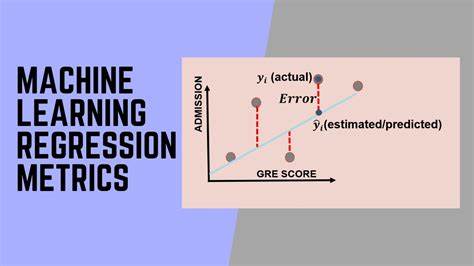
The performance of a machine learning model can be understood by knowing the error predictions rate of the model. In this post, you will learn how to measure the performance of regression models.
A good regression model is one where the difference between the observed values and predicted values is small.
Absolute Error
Absolute Error is the simplest metric. Absolute Error is the amount of error in your measurements. It is the difference between the measured value and true value. For example, if a scale states 100 pounds but you know your true weight is 89 pounds, then the scale has an absolute error of 100 lbs – 89 lbs = 11 lbs.

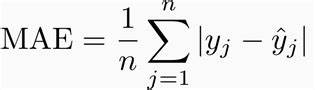
Mean Absolute Error
Mean Absolute Error (MAE) is the average of all absolute errors. MAE is measured by taking the average of the absolute difference between actual values and the predictions. The less value of MAE means better performance of your model.
Root Mean Square Error
Root Mean Square Error is measured by taking the square root of the average of the squared difference between the prediction and the actual value. It is calculated using the following formula:
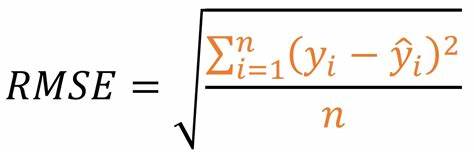
RMSE value is greater than of MAE. This is because RMSE takes the square of the differences between the predictions and the actual value.
RMSE will give higher weight to the errors and punish large errors in the model, therefore RMSE is highly sensitive to outlier values. It is recommended, you must remove the outliers from your dataset prior using this metric. RMSE is the default the loss function in many models. When you have more samples then reconstructing the error distribution using RMSE is more reliable.
Coefficient of Determination or R2
Coefficient of Determination measures how well the actual outcomes are replicated by the regression line. It helps you to understand how well the independent variable adjusted with the variance in your model. That means how good is your model for a dataset. It is calculated using the following formula:
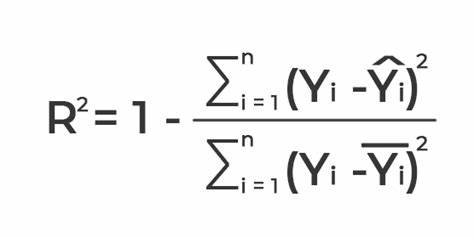
Here the green line represents the regression line and the red line represents the average line. The differences in data points from these lines are taken in the equation. The coefficient of determination is always positive, between 0 to 1. The closer value to one means better model. This is because either your regression line has well fitted the dataset or the data points are distributed with low variance.
Recommended for you:
Machine Learning Metrics
Data Leakage in Machine Learning


MOST COMMENTED
Tutorial
Important Methods in Matplotlib
Machine Learning
Bias and Variance Tradeoff Machine Learning
Tutorial
Multiclass and Multilabel Classification
Machine Learning
Reinforcement Learning in Machine Learning
Deep Learning
Alexnet Architecture Code
Machine Learning
Machine Learning Models Explained