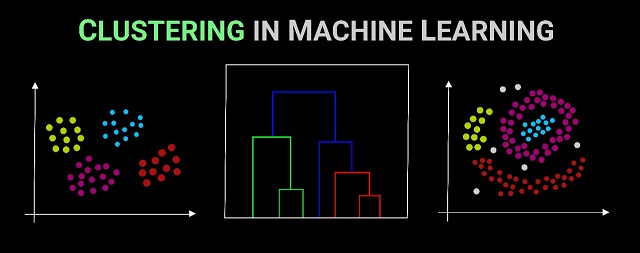
Machine learning is building a predictive model using historical data to make predictions on new data. Clustering is also a machine learning technique used to find distinct groups in a dataset. Clustering algorithms group datapoints in clusters in a way that similar datapoints are grouped together.
Since, the output of model is probabilistic, evaluating your predictions becomes a crucial step. In this post, we will explore some of the most popular evaluation metrics for clustering problems.
Measure Clustering Performance
For clustering a dataset with no target to aim for, we need to look for other types of measurement that give us an indication of performance. The most common measurement for cluster performance is the distinctness of the clusters created, this is because the most common goal for clustering is to create clusters that are as unique as possible.
Best Clustering Metrics
The most common ways of measuring the performance of clustering models are to either measure the distinctiveness or similarity between the groups. Given this, there are three common metrics to use.
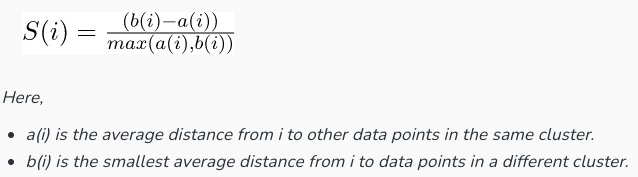
Silhouette Score
Silhouette Score compares the similarity of datapoints within the same cluster to datapoints in different clusters. It is the mean silhouette coefficient for all clusters, which is calculated using the mean intra-cluster distance and the mean nearest-cluster distance. This score is between -1 and 1, where the higher the score the more well-defined your clusters are. Silhouette Score mathematical formula is calculated as:
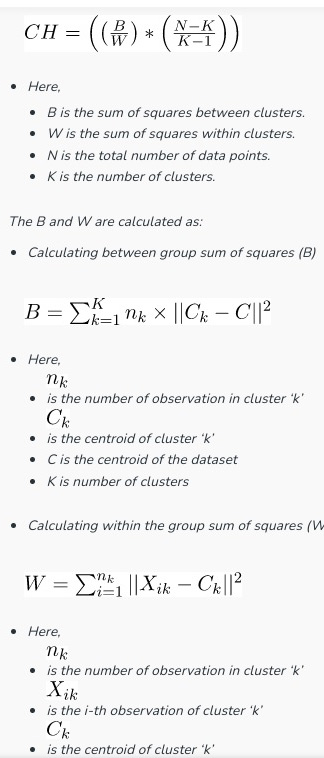
Calinski-Harabaz Index
Calinski-Harabasz Index measures the ratio of between-cluster dispersion to within-cluster dispersion in order to measure the distinctiveness between groups. Like Silhouette score, the higher the score the more well-defined the clusters are. Calinski-Harabasz score has no bound. Meaning there is no acceptable value. Calinski-Harabasz index mathematical formula is calculated as:
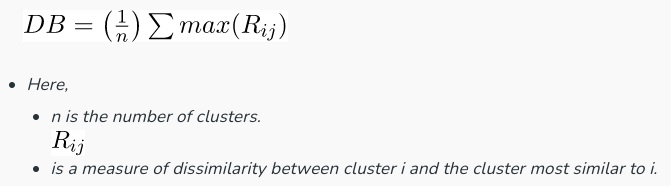
Davies-Bouldin Index
Davies-Bouldin Index estimates the average similarity between each cluster and its most comparable cluster. It evaluates the clustering quality by considering both the separation between clusters and their compactness. Davies-Bouldin Index score measures the similarity of your clusters, meaning that the lower the score the better separation there is between your clusters. Davies-Bouldin index mathematical formula is calculated as:
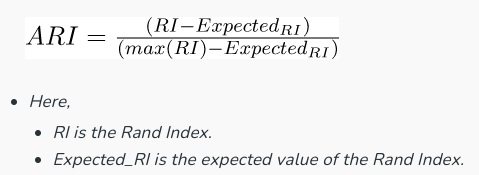
Adjusted Rand Index
The adjusted rand index is an evaluation metric that is used to measure the similarity between two clustering by considering all the samples pairs and calculating the counting pairs of the assigned in the same or different clusters in the actual and predicted clustering.
It measures the quality of clustering by comparing how well the clusters align with the true labels. It ranges the comparing result from -1 to 1, where 1 indicates perfect clustering, 0 indicates random clustering, and negative values suggest poor clustering. Adjusted Rand index mathematical formula is calculated as:
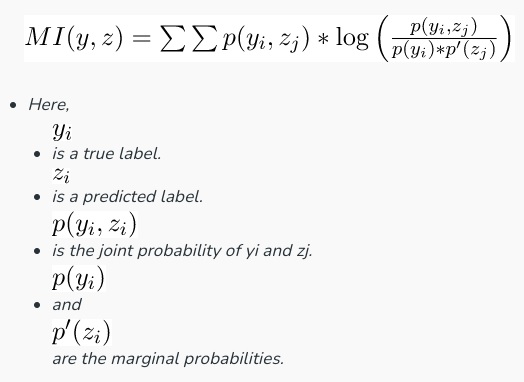
Mutual Information
Mutual Information is used to assess the agreement between the true labels of datapoints and the cluster assignments produced by a clustering algorithm. It quantifies the shared information and measures how well the clusters capture the underlying structure in dataset. Meaning it is used to check the mutual information in the actual label target versus the predicted label, High values indicate better alignment between clusters and true labels. Mutual Information mathematical formula is calculated as:
What is the best Clustering Metric?
The most commonly used metric for comparing the performance of a clustering algorithm is the Silhouette Score which has an upper and lower bound, that’s bounded between -1 and 1.
Recommended for you:
MOST COMMENTED
Tutorial
Important Methods in Matplotlib
Machine Learning
Bias and Variance Tradeoff Machine Learning
Tutorial
Multiclass and Multilabel Classification
Machine Learning
Reinforcement Learning in Machine Learning
Deep Learning
Alexnet Architecture Code
Machine Learning
Machine Learning Models Explained