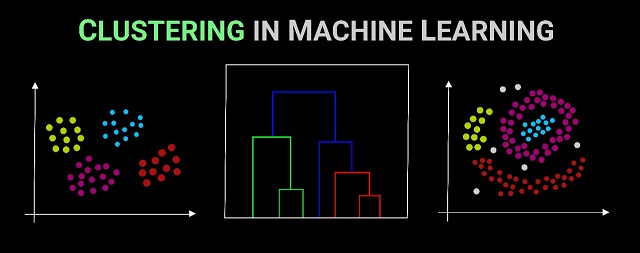
Clustering also known as unsupervised learning is a machine learning technique that looks for patterns in a dataset with no pre-existing labels. By applying Clustering techniques to data, machine learning engineers can acquire crucial insights by seeing which groups the datapoints fall into.
Clustering techniques help in putting items together so that objects in the same cluster are more similar to those in other clusters. Clusters are formed by utilizing parameters like the shortest distances, the density of datapoints, graphs, other statistical distributions.
In simple words, in datasets containing more than two variable quantities, clustering is used to find groupings of related items.
Basics of Clustering
Clustering is a popular technique used in machine learning to group similar datapoints based on their characteristics. It works by partitioning a set of datapoints into number of clusters, where each cluster represents a group of similar datapoints. Main concepts in clustering include:
- Datapoints
- These are individual instances in the dataset.
- Cluster
- It is a group of datapoints.
- Centroid
- It is the centers of the clusters, calculated as the mean of all datapoints in the cluster.
- Distance
- It is the measure of dissimilarity between two datapoints.
- Linkage
- It is used to combine the similarity between two datapoints to determine their distance from each other.
- Criteria
- This is the objective function used to evaluate the quality of the clustering.
- Density
- This is a degree to which a datapoint belongs to its assigned cluster.
- Algorithm
- Algorithms analyze the similarities between datapoints to determine which datapoints should be grouped together in the same cluster. The algorithm aims to minimize the squared distance between datapoints and their respective centroids.
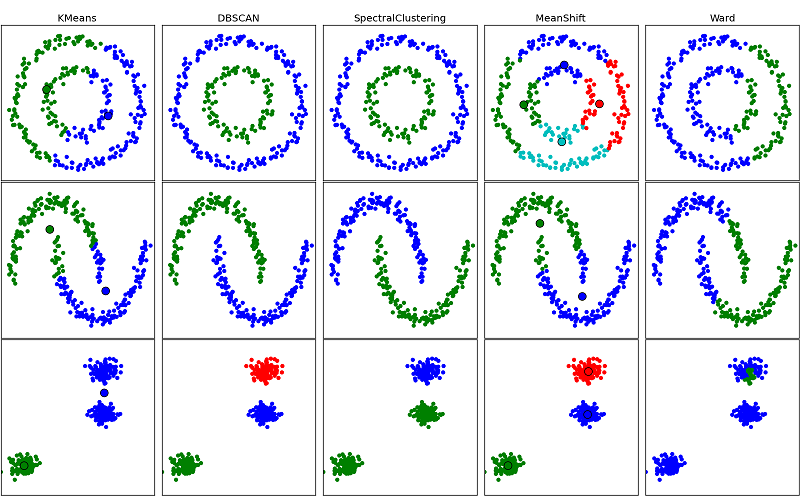
Partitioning-based Clustering
Partitioning technique is the form of non-hierarchical that generally handle statics sets with the aim of exploring the groups exhibited in data via optimization techniques of the objective function.
Partitioning datapoints into n number of clusters where each partition makes a cluster, these clusters hold certain properties, such as each cluster should consist of at least one datapoint and each datapoint should be classified to exactly one cluster.
Partitioning-based technique is highly efficient in terms of simplicity, proficiency, and easy to deploy, and computes all attainable clusters synchronously.
Expectation Maximization Clustering
Expectation Maximization is a technique that can overcome the shortcomings of K-Means algorithm. The optimization clustering approach uses the Gaussian function to estimate missing values from the existing datasets sensibly. Then, using optimized mean and standard deviation values, it restrictively shapes the clusters. The whole optimization procedure is repeated until a single cluster emerges that closely resembles the likelihood of outcomes.
In expectation maximization technique the number of clusters must be chosen, and the parameters of the gaussian distribution for each cluster must be randomly initialized based on an estimate from the data. When a data point is near the Gaussian center, the probability (if datapoint belongs to the specified cluster) increases.
Hierarchical Clustering
Hierarchical clustering technique creates a cluster having a tree-like structure where each newly formed clusters are made using priorly formed clusters. The mapped datapoints may belong to a cluster with distinct qualities in terms of multidimensional scaling, cross-tabulation, or quantitative relationships among data variables in several aspects. Hierarchical clustering categorized into agglomerative and divisive. Divisive clustering considers the complete population as one cluster and then segments into smaller groups.
Agglomerative Hierarchical Clustering
Agglomerative Hierarchical Clustering starts by considering each datapoint as an individual cluster. The algorithm then iteratively merges the two closest clusters into a single cluster until all datapoints belong to the same cluster. The distance between clusters can be measured using different methods such as single linkage, complete linkage, or average linkage.
The procedure employs average linkage with a chosen distance metric to define the average distance of datapoints in a cluster pair and margin them until convergence is achieved through multiple iterations.
We don’t need to define the number of clusters in agglomerative hierarchical clustering, because we’re forming a tree.
Density-Based Clustering
Density-based clustering identifies clusters as areas of high density separated by areas of low density. Aims to group together datapoints that are close to each other and have a higher density than the surrounding datapoints.
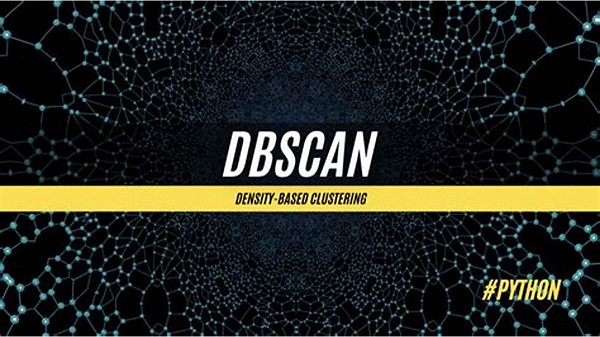
Density-based Spatial Clustering Algorithm with Noise (or DBSCAN) is a super algorithm when it comes to discovering clusters in geographical databases. DBSCAN starts with an unseen datapoint and uses epsilon to extract the neighborhood before designating datapoint as visited. If two points are within a certain distance of each other, they have termed neighbors.
Distribution-Based Clustering
Distribution-based clustering considers datapoints as parts of a cluster based on the probability that they belong to a given cluster. It works with center-point, and as the distance of a datapoint from the center increases, the probability of it being a part of that cluster decreases. If you aren’t sure of the distribution type in your data, you should consider a different type of algorithm.
Centroid-Based Clustering
Centroid-based clustering is fast, efficient and sensitive to the initial parameters you give it. Centroid-based algorithms separate datapoints based on multiple centroids in the data. Each datapoint is assigned to a cluster based on its squared distance from the centroid. This technique is the most commonly used type of clustering in machine learning.
Spectral Clustering
Consider the structure similar to a graph where all the nodes are connected to all other nodes with edges constituting of weights. Spectral clustering doesn’t make initial guesses about the clusters that are in the dataset. It treats datapoints like nodes in a graph and clusters are found based on communities of nodes that have connecting edges. Spectral clustering eliminates the edges which have the lowest weight.
Grid-Based Clustering
Grid-based technique follows a grid-like structure, i.e. data space is organized into a finite number of cells to design a grid-structure. Various clustering operations are conducted on such grids and are quickly responsive and do not rely upon the quantity of datapoints. Also, the performance of grid-based technique is proportional to the grid-size and demands very less space than the actual data stream.
Model-Based Clustering
Model-based technique deploy a predefined mathematical model for fitting and later on optimizing the data while assuming that the data is hybrid in the form of probability distributions and compute the number of clusters on the basis of standard statistics.
However, the noise and outliers are taken into account while calculating the standard statistics for having robust clustering. In order to form clusters, these clustering methods are classified into two categories: Statistical, that follow probability measures for determining clusters, and Neural Network approach methods, in that input and output are associated with unit carrying weights.
How to choose the best Clustering Technique?
The following are some factors to consider when selecting clustering approach.
- Dataset characteristics
- Different techniques are suitable for different datasets.
- Number of clusters
- The choice of technique may depend on the number of clusters required.
- Interpretability
- Some technique such as hierarchical clustering, provide a more interpretable result than other techniques.
- Metric
- It is important to evaluate the clustering results using suitable evaluation metrics. The choice of metric will depend on the specific requirements of the analysis.
It is recommended for you:
MOST COMMENTED
Tutorial
Important Methods in Matplotlib
Machine Learning
Bias and Variance Tradeoff Machine Learning
Tutorial
Multiclass and Multilabel Classification
Machine Learning
Reinforcement Learning in Machine Learning
Deep Learning
Alexnet Architecture Code
Machine Learning
Machine Learning Models Explained