When a Machine Learning model is built, various evaluation metrics are used to check the quality or the performance of a model. For classification models, metrics such as Accuracy, Confusion Matrix, Classification report , and AUC-ROC curve are used.
In this post, we will deep dive into the most common evaluation metric which is Confusion Matrix and will understand all the elements of it in detail.
What is Confusion Matrix?
A confusion matrix presents a table layout of the different results of a classification problem and helps visualize its outcomes. It is a class-wise distribution of the predictive performance of a classification model. the confusion matrix is an organized way of mapping the predictions to the original classes to which the data belong.
Furthermore, suppose there is a significant class imbalance in the data. In that case, i.e., a class has more instances of data than the other classes, a model might predict the majority class for all cases and have a high accuracy score; when it is not predicting the minority classes. This is where confusion matrices are useful. This also implies that confusion matrices can only be used when the output distribution is known, i.e., in supervised learning frameworks.
The confusion matrix not only allows the calculation the accuracy of a classifier, but also helps compute other important metrics that developers often use to evaluate their models.

Elements of Confusion Matrix
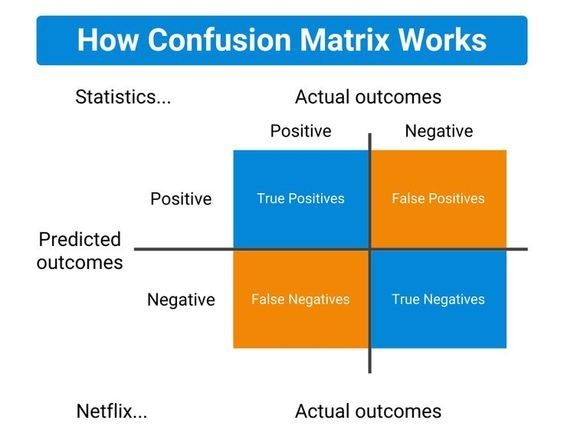
It represents the different combinations of Actual values vs Predicted values.
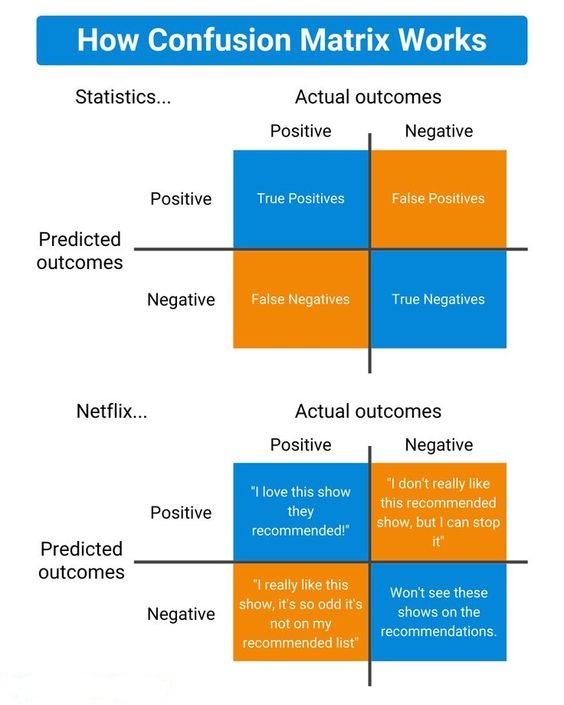
- TP: True Positive:
- The number of times our actual positive values are equal to the predicted positive. You predicted a positive value, and it is correct.
- FP: False Positive:
- The values which were actually negative but falsely predicted as positive. Also known as Type 1 Error.
- FN: False Negative:
- The values which were actually positive but falsely predicted as negative. Also known as Type 2 Error.
- TN: True Negative:
- The values which were actually negative and were predicted negative.
The target variable has two values: Positive or Negative.
The columns represent the actual values of the target variable.
The rows represent the predicted values of the target variable.
Let’s understand TP, FP, FN, TN in terms of pregnancy analogy.
True Positive:
Interpretation: You predicted positive and it’s true.
You predicted that a woman is pregnant and she actually is.
True Negative:
Interpretation: You predicted negative and it’s true.
You predicted that a man is not pregnant and he actually is not.
False Positive:
Interpretation: You predicted positive and it’s false.
You predicted that a man is pregnant but he actually is not.
False Negative:
Interpretation: You predicted negative and it’s false.
You predicted that a woman is not pregnant but she actually is.
We describe predicted values as Positive and Negative and actual values as True and False.
Classification Measures
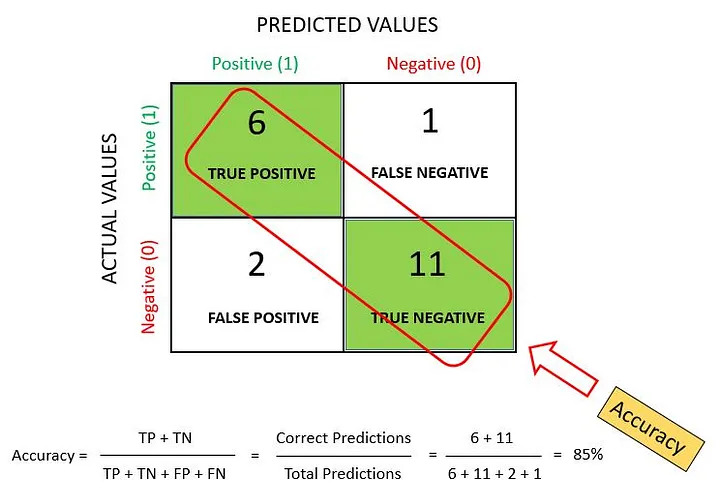
Accuracy
Accuracy measures how often the classifier makes the correct prediction. It is the ratio between the number of correct predictions and the total number of predictions. Accuracy metric is not suited for imbalanced classes, when the model predicts that each point belongs to the majority class label, the accuracy will be high. But the model is not accurate. It is a measure of correctness that is achieved in true prediction. In simple words, it tells us how many predictions are actually positive out of all the total positive predicted.
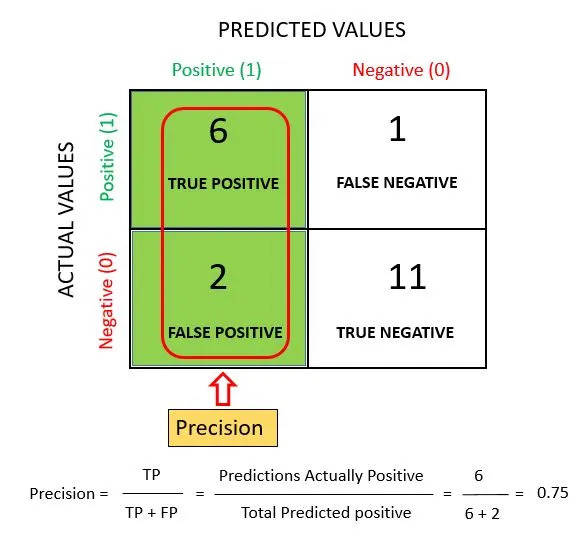
Precision
It is a measure of correctness that is achieved in true prediction. Precision tells us how many predictions are actually positive out of all the total positive predicted.
Precision is defined as the ratio of the total number of correctly classified positive classes divided by the total number of predicted positive classes. Precision is a useful metric in cases where False Positive is a higher concern than False Negatives.
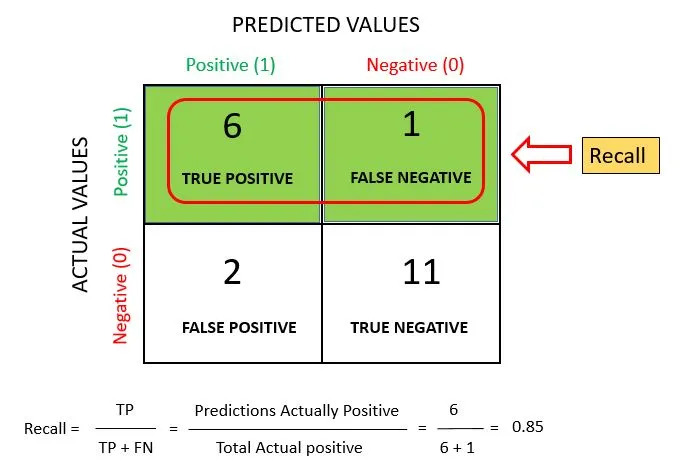
Recall
Recall is also known as Sensitivity. It is a measure of actual observations which are predicted correctly, i.e. how many observations of positive class are actually predicted as positive.
Recall is defined as the ratio of the total number of correctly classified positive classes divide by the total number of positive classes.
Recall is a useful metric in cases where False Negative trumps False Positive.
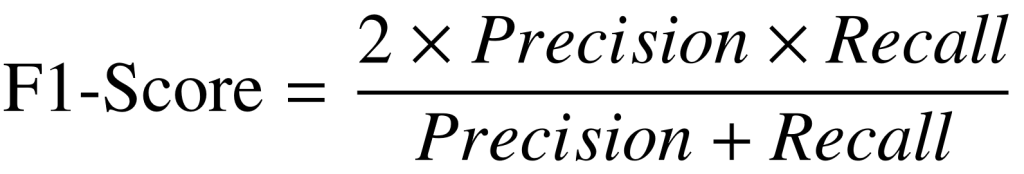
F1-Score
F1-Score is a number between 0 and 1 and is the harmonic mean of precision and recall. Harmonic mean is not sensitive to extremely large values, unlike simple averages. F1-Score sort of maintains a balance between the precision and recall for your classifier. If your precision is low, the F1 is low and if the recall is low again your F1 score is low.
In practice, when we try to increase the precision of our model, the recall goes down and vice-versa. The F1-score captures both the trends in a single value.
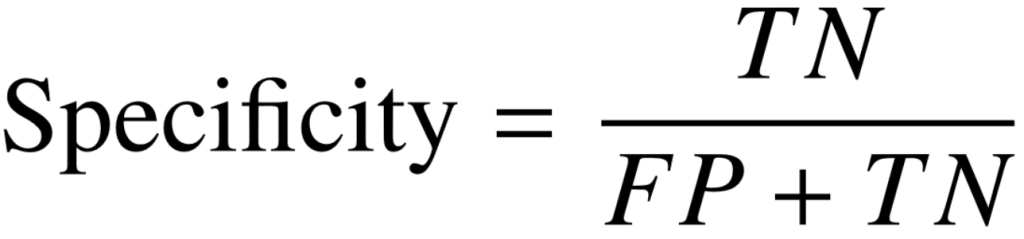
Specificity
Number of samples predicted correctly to be in the negative class out of all the samples in the dataset that actually belong to the negative class.
When to use Accuracy – Precision – Recall or F1-Score?
Accuracy is the standard metric to go for to evaluate a classification machine learning model. But We can not rely on Accuracy all the time as in some cases accuracy gives us a wrong interpretation of the quality of the model, for example in the case when our dataset is imbalanced or dealing with a domain-specific project.
In some cases of imbalanced data problems we consider the F1-Score as an evaluation metric.
Domain-Specific case: example of stock market crash prediction, imagine a situation where our model has wrongly predicted that the market will not crash and instead it crashed, the people have to go through a lot of losses in this case.
The measure which takes into account this problem is Recall. So we need to focus on reducing the value of FN and increasing the value of Recall. In most medical cases, such as cancer prediction or any disease prediction we try to reduce the value of FN.
In the case of email spam detection, if an email is predicted as a spam but is not actually a spam then it can cause problems to the user. In this case, we need to focus on reducing the value of FP (i.e when the mail is falsely predicted as spam) and as a result, increasing the value of Precision.
Confusion Matrix Infographic
I hope I’ve given you good understanding of what is confusion matrix.
I am always open to your questions and suggestions.
You can share this post on Linkedin, Facebook, Twitter, so someone in need might stumble upon this.
Recommended for you:
Machine Learning Metrics
Concepts of Data Science

MOST COMMENTED
Tutorial
Important Methods in Matplotlib
Machine Learning
Bias and Variance Tradeoff Machine Learning
Tutorial
Multiclass and Multilabel Classification
Machine Learning
Reinforcement Learning in Machine Learning
Deep Learning
Alexnet Architecture Code
Machine Learning
Machine Learning Models Explained