Data is powerful, and organizations around the world understand the value that data analytics hold when it comes to driving organizational growth and profitability. Whether you’re a recent graduate or looking to make a career switch, this post talk about the foundational knowledge you need to kickstart your career in data.
What is Data Analytics?
Data analytics is the science of analyzing raw data to make information. It is the process of collecting, organizing, and analyzing raw data from different sources. You can then gain insights to help organizations make important predictions and decisions.
Data analytics mostly involves studying data trends over a given period, and then extracting useful information from these trends. This idea lies at the root of data analysis. When we can extract meaning from data, it empowers us to make better decisions.
Companies are wisening up to the benefits of leveraging data. Data analysis can help a business to personalize customer interactions, a health care system to predict future health needs.
Understanding Data Analytics
Data analytics is a term that encompasses many diverse types of data analysis. Any type of information can be subjected to data analytics techniques to get insight that can be used to improve things.
Data analytics techniques can reveal trends and metrics that would otherwise be lost in the mass of information. This information can then be used to optimize processes to increase the overall efficiency of a business or system.
Implementing it into the business model means companies can help reduce costs by identifying more efficient ways of doing business and by storing large amounts of data. Gaming companies use data analytics to set reward schedules for players that keep the majority of players active in the game. Content companies use many of the same data analytics to keep you watching, or re-organizing content to get another view.
Data Analysis Steps
As data available to companies continues to grow in amount and complexity, so too does the need for an efficient process by which to harness the value of data. The data analysis process typically moves through several iterative phases. Let’s take a look at each phase.
- The first step is to collect raw datasets you’ll need to help you answer the identified question. Data collection might come from internal sources, like a company’s client relationship management software, or from secondary sources, like government records or social media application programming interfaces.
- The data must be organized after it’s collected so it can be analyzed. This may take place on a spreadsheet, database or other form of software that can take statistical data.
- Then data is cleaned up before analysis. to ensure that there’s no duplication, missed values or error. This step helps correct any errors before it goes on to a data analyst to be analyzed.
- The fourth step is to determine how the data is grouped. Data may be separated by age, demographic, income, or gender. Data values may be numerical or divided by category.
- Analyze the data. During this stage, you might use data mining to discover patterns within databases or data visualization software to help transform data into an easy-to-understand graphical format.
- Interpret the results of your analysis to see how well the data answered your original question. Identify the business question you’d like to answer. What problem is the company trying to solve? What do you need to measure, and how will you measure it?
Types of Data Analytics
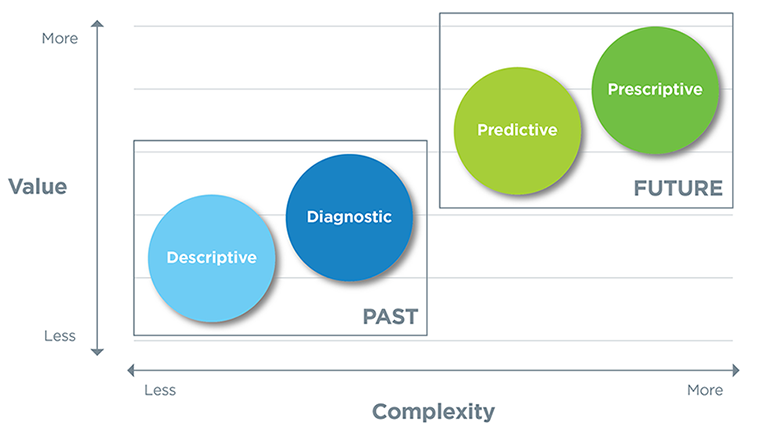
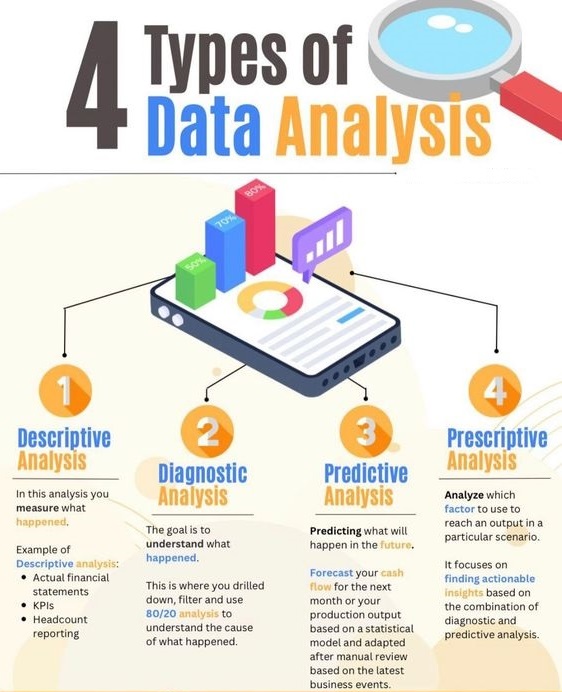
Data analytics is broken down into four basic types.
- Descriptive Analytics
- Descriptive analytics provides a current snapshot by identifying trends and patterns of past and current data. It answers questions about what has happened in the past and what is happening now. Have the number of views gone up? Are sales stronger this month than last. such as:
- Line graphs
- Bar charts
- Tables
- Pie charts
- Descriptive analytics provides a current snapshot by identifying trends and patterns of past and current data. It answers questions about what has happened in the past and what is happening now. Have the number of views gone up? Are sales stronger this month than last. such as:
- Diagnostic analytics
- Diagnostic analytics focuses on the reasonings behind trends and patterns that are identified in the previous stage, helping to discover the factors for past performance. It involves more diverse data inputs and a bit of hypothesizing. Did the weather affect beer sales? Did that latest marketing campaign impact sales. such as:
- Data drilling
- Data mining
- Data discovery
- Data correlation
- Data transformation
- Diagnostic analytics focuses on the reasonings behind trends and patterns that are identified in the previous stage, helping to discover the factors for past performance. It involves more diverse data inputs and a bit of hypothesizing. Did the weather affect beer sales? Did that latest marketing campaign impact sales. such as:
- Predictive analytics
- Predictive analytics uses techniques like machine learning and forecasting to determine what is likely to happen in the future. How many weather models predict a hot summer this year. such as:
- Machine learning
- Predictive modeling
- Pattern matching
- Forecasting
- Predictive analytics uses techniques like machine learning and forecasting to determine what is likely to happen in the future. How many weather models predict a hot summer this year. such as:
- Prescriptive analytics
- Prescriptive analytics uses machine learning, algorithms and business rules to provide specific solutions and recommendations on what to do next to achieve a desired outcome. such as:
- machine learning
- advanced algorithms
- simulations
- Prescriptive analytics uses machine learning, algorithms and business rules to provide specific solutions and recommendations on what to do next to achieve a desired outcome. such as:
Data Analytics Tools
The most commonly used tools for data analysis are simple spreadsheeting programs such as Microsoft Excel. These applications allow users to import data, apply transformations and visualize aggregated data in one place with a simple user interface. Some of the technologies that make modern data analytics so powerful are:
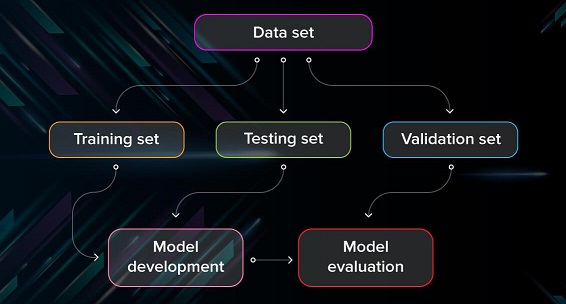
- Machine learning
- Machine learning is significant for data analytics and involves algorithms that can learn on their own. ML enables applications to take in data and analyze it to predict outcomes. You can train a machine learning algorithm on a small sample of data, and the system will continue to learn as it gathers more data, becoming more accurate as time goes on.
- Data Management
- Before you analyze data, you need to have procedures in place for managing the flow of data in and out of your systems and keeping your data organized. You also need to ensure that your data available for use when needed.
- Data Mining
- Data mining refers to the process of sorting through large amounts of data to identify patterns and discover relationships between data points. It enables you to sift through large datasets and figure out what’s relevant. You can then use this information to conduct analyses and inform your decisions.
Why Is Data Analytics Important?
Data analytics underpins many quality control systems in the financial world, including the ever-popular Six Sigma program.
Another sectors that have adopted the use of data analytics include the travel industry where turnarounds can be quick. This industry can collect customer data and figure out where problems, if any, lie and how to fix them. Healthcare combines the use of high volumes of structured and unstructured data and uses data analytics to make quick decisions.
Data analytics can help organizations evaluate how well or badly they’ve performed over a specified period. This will enable them to make important decisions for the future of the organization.
Data Analytics Infographic
I hope I’ve given you good understanding of Data Analytics.
I am always open to your questions and suggestions.
You can share this post on LinkedIn, Facebook, Twitter, so someone in need might stumble upon this.
Recommended for you:
What is Data Mining?
Data Lake vs Data Warehouse
MOST COMMENTED
Tutorial
Important Methods in Matplotlib
Machine Learning
Bias and Variance Tradeoff Machine Learning
Tutorial
Multiclass and Multilabel Classification
Machine Learning
Reinforcement Learning in Machine Learning
Deep Learning
Alexnet Architecture Code
Machine Learning
Machine Learning Models Explained