Probability distributions are one of the most used mathematical concepts used in various real-life applications. They are simply a collection of data of a particular random variable. Usually, these collections of data are arranged in some order and can be presented graphically. Whenever we start a new data science project, we typically obtain a data set; this data set represents a sample from a population, which is a larger data set. Using this sample, we can try and find distinctive patterns in the data that help us make predictions about our main inquiry.
Distribution Characteristics
The dataset used to draw the distribution defines the distribution’s shape. We can describe each distribution using three characteristics: the mean, the variance and the standard deviation. These characteristics can tell us different things about the distribution’s behavior.
- Mean
- The mean is simply the average of a dataset.
- Variance
- The variance is the average of the squared differences from the mean.
- Standard Deviation
- The standard deviation is a measure of how spread out the numbers are in a data set. So, a small standard deviation indicates that the values are closer to each other, while a large standard deviation indicates the dataset values are spread out.
Data Types
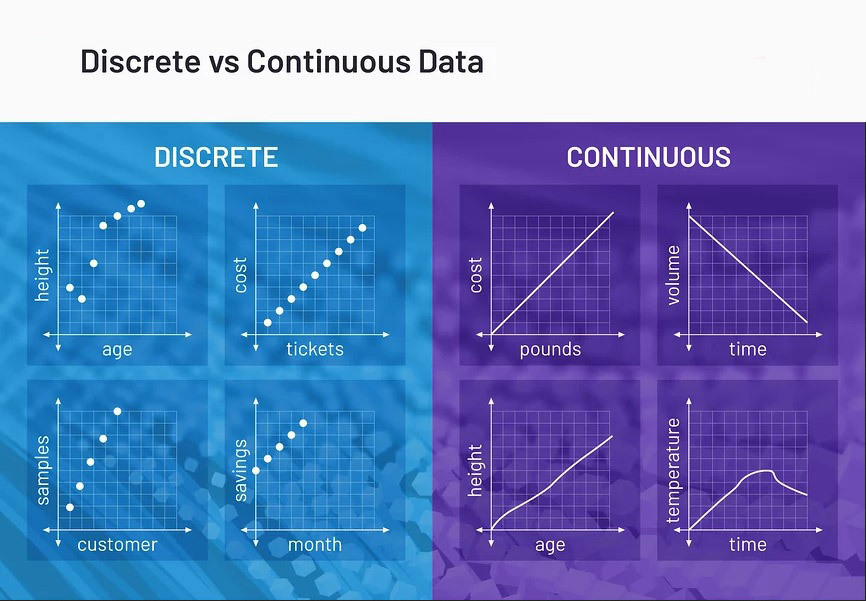
There are two different types of data in statistics: discrete and continuous data.
- Discrete Data
- Discrete data involves variables that have specific values that cannot have values between them. For example, the number of times someone visits their neighbors during the week is a discrete variable. Categorical variables (e.g., genres of music, names) are also considered discrete variables because they involve clear categorical boundaries.
- Continuous Data
- Continuous data involves variables in which there could be an infinite number of values between a set range of possible values. For example, students can theoretically score an infinite number of exam grades on a scale of 0 to 100. Another example of a continuous variable are things measured in datetime.
The most Common Distributions
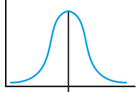
NORMAL DISTRIBUTION
Gaussian distribution also called normal distribution is famous for its bell-like shape, and it’s one of the most commonly used distributions in data science. Many real-life phenomena follow normal distribution, such as peoples’ height, blood pressure. A normal distribution is when the trend of frequencies on the left and right side of the distribution are the same.
When dealing with the normal distribution, there’s one important rule to keep in mind. This rule states that 68% of the data in a normal distribution is between -σ and σ, 95% will be between -2σ and 2σ, and 99.7% of the data will be between -3σ and 3σ.
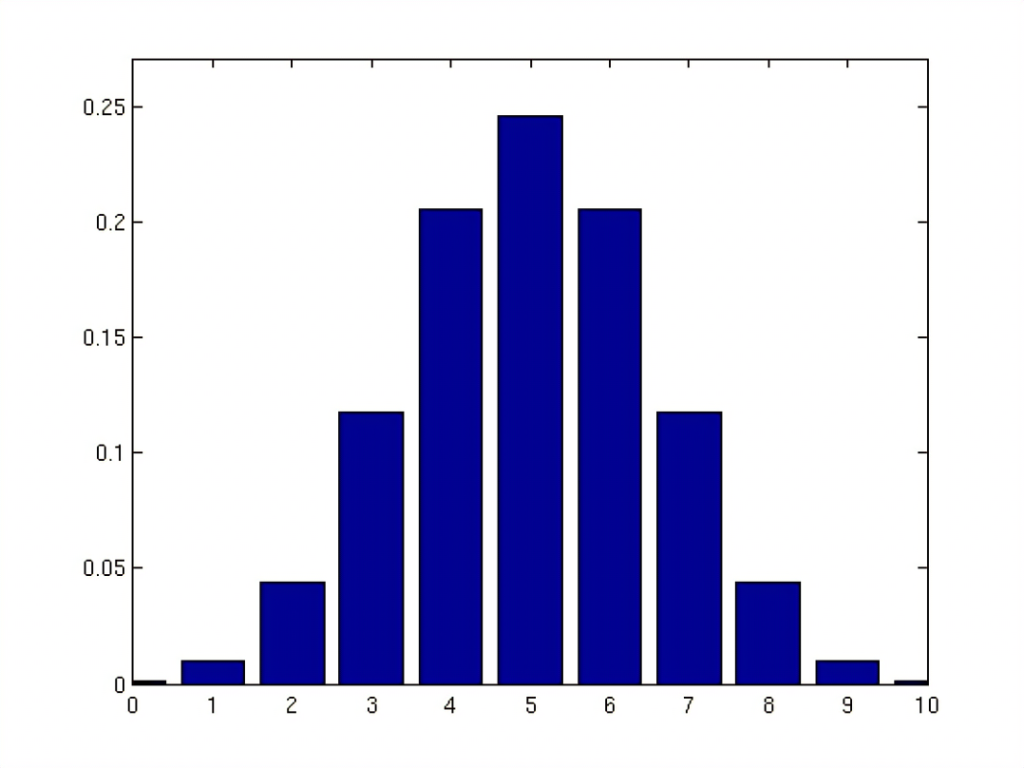
Binomial Distribution
The binomial distribution is used when there are only two possible outcomes for each trial, such as success or failure, yes or no etc. with equal probabilities for each product. The binomial distribution can be used to calculate the likelihood of achieving a specific result from independent trials that have only two possible effects.
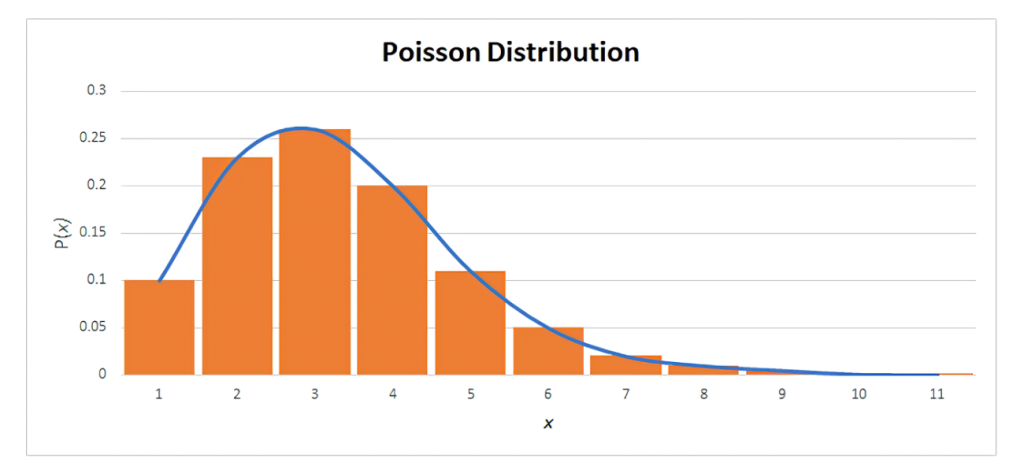
Poisson Distribution
Poisson distribution deals with the frequency with which an event occurs within a specific interval. Instead of the probability of an event, Poisson distribution requires knowing how often it happens in a particular period or distance.This type of distribution is useful for modelling random occurrences such as customer arrivals at stores etc, where the average rate of occurrence is known but the exact timing cannot be measured.
Hypergeometric Distribution
The hypergeometric distribution describes the probability of a certain number of successes or failures in a given number of draws from an population when the draws are made without replacement. This type of data distribution is used in situations where an population contains different items, such as colored balls, and you want to evaluate the probability that a certain number of those items will be drawn out with each draw being made without replacing the item that was just taken out.
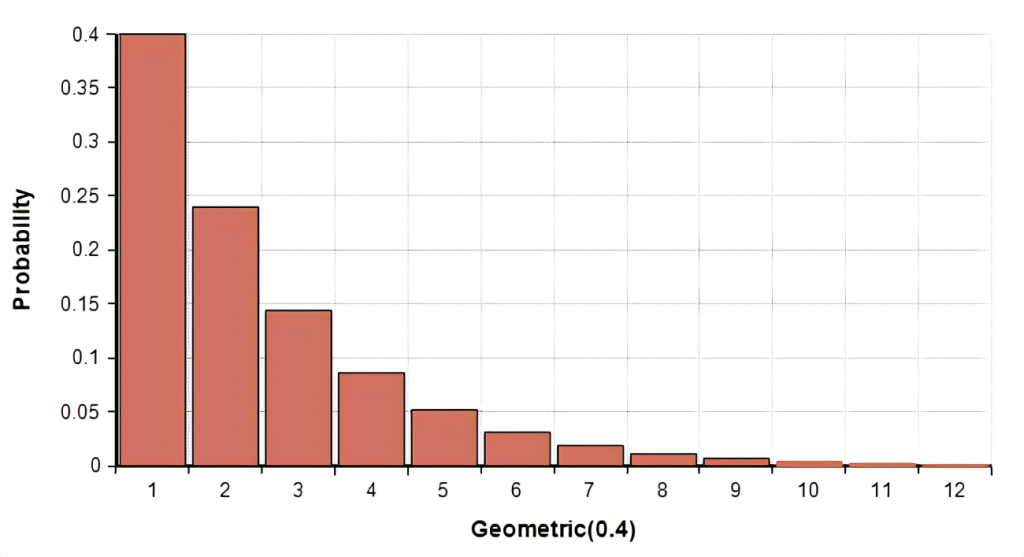
Geometric Distribution
The geometric distribution describes the probability of a success occurring on any given trial in a series of independent trials when the probability of success for each trial is known. This type of data distribution can be used to model the number of failures that occur before a success in situations such as manufacturing processes, where there are multiple attempts at creating a product and each attempt has a given probability of success.
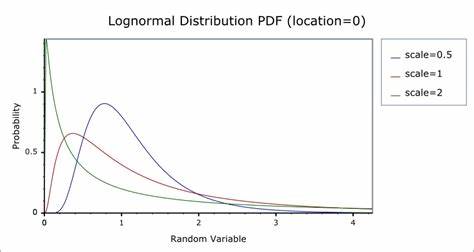
Lognormal Distribution
Lognormal distributions measure data points in a curve shaped like a sigmoid function. a curved line beginning at zero and then increasing sharply to a peak and slowly decreasing. Lognormal distributions is often used in financial data, allowing us to extrapolate potential future stock prices based on past data.
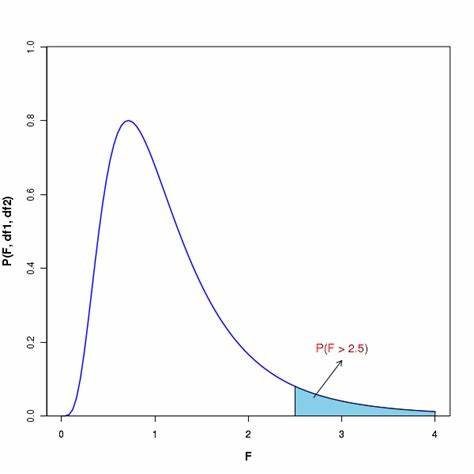
F Distribution
F Distributions measure data points spread out over a broader range than normal distributions. F Distributions is often used when measuring data with higher variability, such as performance or customer satisfaction surveys.
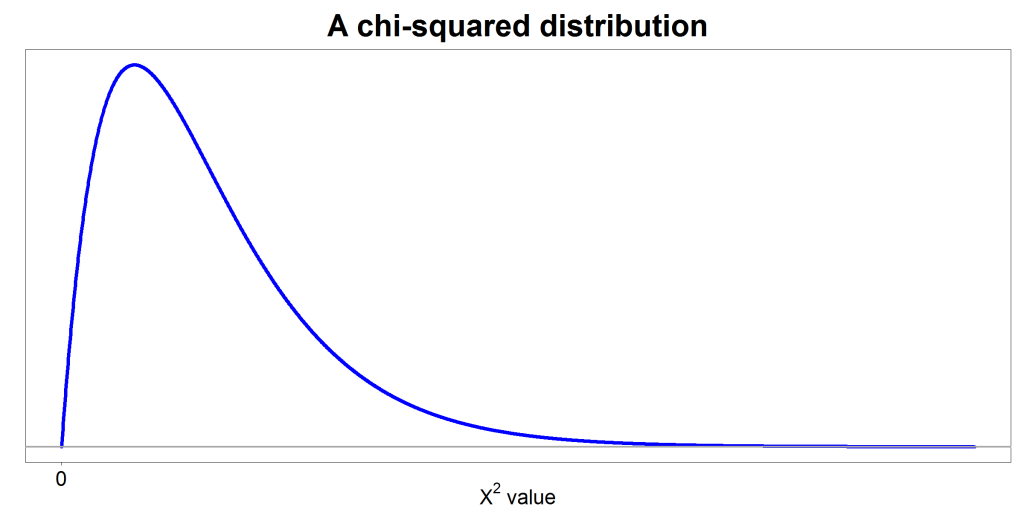
Chi-Square Distribution
Chi-Square Distributions measure the difference between observed data and expected results. Chi-Square Distribution can be used to identify significant differences between two datasets and help us understand which factors may be influencing our results.
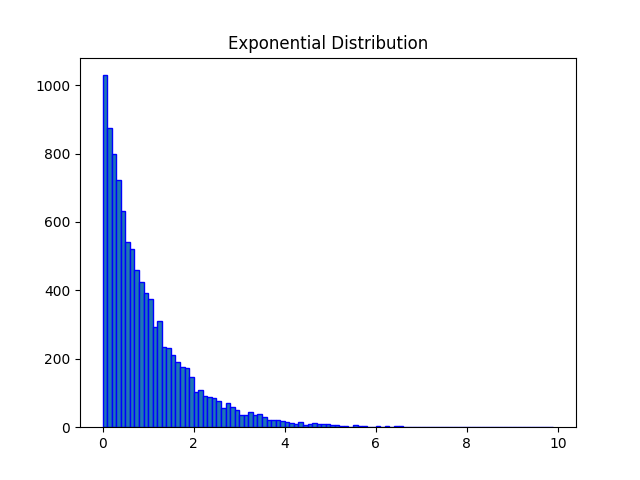
Exponential Distribution
Exponential distributions measure data points with an exponential curve. a curve beginning at zero and gradually increasing in value.
For example, in physics, it is often used to measure radioactive decay; in engineering, to measure the time associated with receiving a defective part on an assembly line; and in finance, to measure the likelihood of the next default for a financial portfolio.
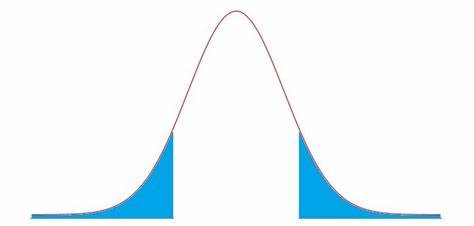
T Student Distribution
T Student Distributions, also known as the T distribution, is similar to the normal distribution with its bell shape but has heavier tails. T Student Distributions measure data points spread out more than normal distributions. This data distribution can be used for data sets with higher variability and outliers, such as performance data. T distribution is used instead of the normal distribution when you have small sample sizes.
Weibull Distribution
Weibull Distributions measure data in an exponential curve. This data distribution is often used for reliability tests and can help us predict how long it will take for a system to fail.

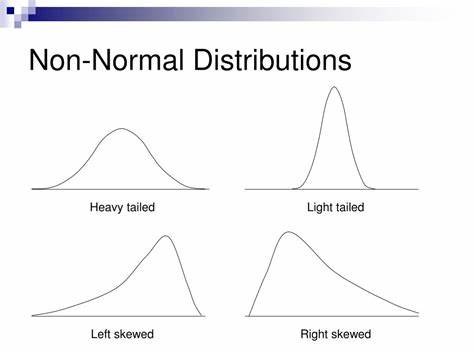
Non-normal Distribution
Non-normal distributions include data distributions such as the Poisson Distribution, Gamma Distribution, Beta Distribution, Logistic and Cauchy Distribution. Non-normal data distributions are often used when data does not fit into the normal data distribution categories, such as highly non-linear or data with noises.
Summary
Knowing data distributionsis an essential component of the data exploration or machine learning model development process. We can adjust our machine learning models to best match the problem if we can identify the pattern in the data distribution. Indeed, specific machine learning models are built to perform best when certain distribution assumptions are met. Knowing which distributions, we’re dealing with may thus assist us in determining which models to apply. Thanks for taking the time to read this post.
Recommended for you:
Linear and Nonlinear data in Machine Learning
Data Science Concepts
MOST COMMENTED
Tutorial
Important Methods in Matplotlib
Machine Learning
Bias and Variance Tradeoff Machine Learning
Tutorial
Multiclass and Multilabel Classification
Machine Learning
Reinforcement Learning in Machine Learning
Deep Learning
Alexnet Architecture Code
Machine Learning
Machine Learning Models Explained