Dataset in Machine Learning
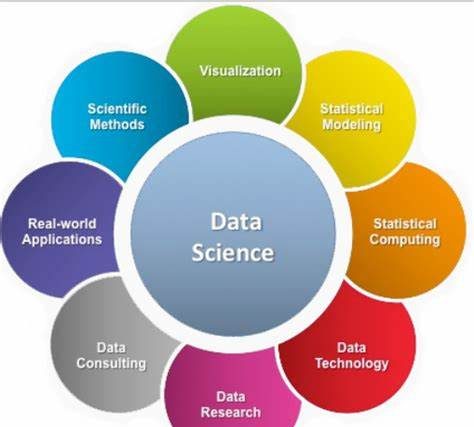
Just as the name implies, data science is a branch of science that applies the scientific method to data with the goal of studying the relationships between different features and drawing out meaningful conclusions based on these relationships. Data is, therefore, the key component in data science. A dataset is a particular instance of data that is used for analysis or model building at any given time.
A dataset comes in different flavors such as numerical data, categorical data, text data, image data, voice data, and video data.
A dataset could be static (not changing) or dynamic (changes with time, for example, stock prices). Moreover, a dataset could depend on space as well. For example, temperature data in the United States would differ significantly from temperature data in Africa. For beginning data science projects, the most popular type of dataset is a dataset containing numerical data that is typically stored in a comma separated values (CSV) file format.
Data Wrangling Meaning
Data wrangling is the process of converting data from its raw form to a tidy form ready for analysis. Data wrangling is an important step in data preprocessing and includes several processes like data importing, data cleaning, data structuring, string processing, HTML parsing, handling dates and times, handling missing data, and text mining.
The process of data wrangling is a critical step for any data scientist. Very rarely is data easily accessible in a data science project for analysis. It is more likely for the data to be in a file, a database, or extracted from documents such as web pages, tweets, or PDFs. Knowing how to wrangle and clean data will enable you to derive critical insights from your data that would otherwise be hidden.
Data Visualizations
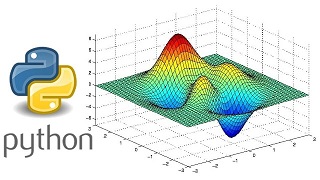
Data Visualization is one of the most important branches of data science. It is one of the main tools used to analyze and study relationships between different variables. Data visualization (e.g., scatter plots, line graphs, bar plots, histograms, qqplots, smooth densities, boxplots, pair plots, heat maps, etc.) can be used for descriptive analytics. Data visualization is also used in machine learning for data preprocessing and analysis, feature selection, model building, model testing, and model evaluation. When preparing a data visualization, keep in mind that data visualization is more of an Art than Science. To produce a good visualization, you need to put several pieces of code together for an excellent end result.
Outliers in Machine Learning
An outlier is a data point that is very different from the rest of the dataset. Outliers are often just bad data, e.g., due to a malfunctioned sensor; contaminated experiments; or human error in recording data. Sometimes, outliers could indicate something real such as a malfunction in a system. Outliers are very common and are expected in large datasets. One common way to detect outliers in a dataset is by using a box plot. Outliers can significantly degrade the predictive power of a machine learning model. A common way to deal with outliers is to simply omit the data points. However, removing real data outliers can be too optimistic, leading to non-realistic models. Advanced methods for dealing with outliers include the RANSAC method.
Data Imputation Meaning
Most datasets contain missing values. The easiest way to deal with missing data is simply to throw away the data point. However, the removal of samples or dropping of entire feature columns is simply not feasible because we might lose too much valuable data. In this case, we can use different interpolation techniques to estimate the missing values from the other training samples in our dataset. One of the most common interpolation techniques is mean imputation, where we simply replace the missing value with the mean value of the entire feature column. Other options for imputing missing values are median or most frequent (mode), where the latter replaces the missing values with the most frequent values.
Whatever imputation method you employ in your model, you have to keep in mind that imputation is only an approximation, and hence can produce an error in the final model. If the data supplied was already preprocessed, you would have to find out how missing values were considered. What percentage of the original data was discarded? What imputation method was used to estimate missing values?
Data Scaling in Machine Learning
Scaling your features will help improve the quality and predictive power of your model. In order to bring features to the same scale, we could decide to use either normalization or standardization of features. Most often, we assume data is normally distributed and default towards standardization, but that is not always the case. It is important that before deciding whether to use either standardization or normalization, you first take a look at how your features are statistically distributed. If the feature tends to be uniformly distributed, then we may use normalization (MinMaxScaler). If the feature is approximately Gaussian, then we can use standardization (StandardScaler). Again, note that whether you employ normalization or standardization, these are also approximative methods and are bound to contribute to the overall error of the model.
Principal Component Analysis (PCA)
Large datasets with hundreds or thousands of features often lead to redundancy especially when features are correlated with each other. Training a model on a high dimensional dataset having too many features can sometimes lead to overfitting (the model captures both real and random effects). In addition, an overly complex model having too many features can be hard to interpret. One way to solve the problem of redundancy is via feature selection and dimensionality reduction techniques such as PCA.
Principal Component Analysis (PCA) is a statistical method that is used for feature extraction. PCA is used for high-dimensional and correlated data. The basic idea of PCA is to transform the original space of features into the space of the principal component. A PCA transformation achieves the following:
a) Reduce the number of features to be used in the final model by focusing only on the components accounting for the majority of the variance in the dataset.
b) Removes the correlation between features.
Linear Discriminant Analysis (LDA)
PCA and LDA are two data preprocessing linear transformation techniques that are often used fordimensionality reduction to select relevant features that can be used in the final machine learning algorithm.
PCA is an unsupervised algorithm that is used for feature extraction in high-dimensional and correlated data. PCA achieves dimensionality reduction by transforming features into orthogonal component axes of maximum variance in a dataset.
The goal of LDA is to find the feature subspace that optimizes class separability and reduce dimensionality. Hence, LDA is a supervised algorithm.
Data Partitioning Machine Learning
In machine learning, the dataset is often partitioned into training and testing sets. The model is trained on the training dataset and then tested on the testing dataset. The testing dataset thus acts as the unseen dataset, which can be used to estimate a generalization error (the error expected when the model is applied to a real-world dataset after the model has been deployed).
Supervised Learning Definition
These are machine learning algorithms that perform learning by studying the relationship between the feature variables and the known target variable. Supervised learning has two subcategories:
- Continuous Target Variables (Algorithms for predicting continuous target variables include)
- Linear Regression
- KNeighbors regression (KNR)
- Support Vector Regression (SVR)
- Discrete Target Variables (Algorithms for predicting discrete target variables include)
- Perceptron classifier
- Logistic Regression classifier
- Support Vector Machines (SVM)
- Decision tree classifier
- K-nearest classifier
- Naive Bayes classifier

Recommended for you:
MOST COMMENTED
Tutorial
Important Methods in Matplotlib
Machine Learning
Bias and Variance Tradeoff Machine Learning
Tutorial
Multiclass and Multilabel Classification
Machine Learning
Reinforcement Learning in Machine Learning
Deep Learning
Alexnet Architecture Code
Machine Learning
Machine Learning Models Explained