DBSCAN (Density-Based Spatial Clustering and Application with Noise), is a density-based clustering algorithm. DBSCAN groups together points that are closely packed together, while filtering out noise points that lie in low-density regions. It can be used to identify clusters of any shape in a dataset containing noise.
Therefore, DBSCAN can be used as an algorithm for anomaly detection, as it is able to distinguish between dense regions (representing normal data) and sparse regions containing very few points, which are labeled as anomalies or noises.
DBSCAN algorithm is based on this intuitive notion of clusters and noise. Clusters are dense regions in the data space, separated by regions of lower density of points. The main idea is that for each point of a cluster, the neighborhood of a given radius has to contain at least a minimum number of points. In contrast to other clustering algorithm, DBSCAN can identify clusters of various shapes and sizes, and it does not require the number of clusters to be specified in advance.
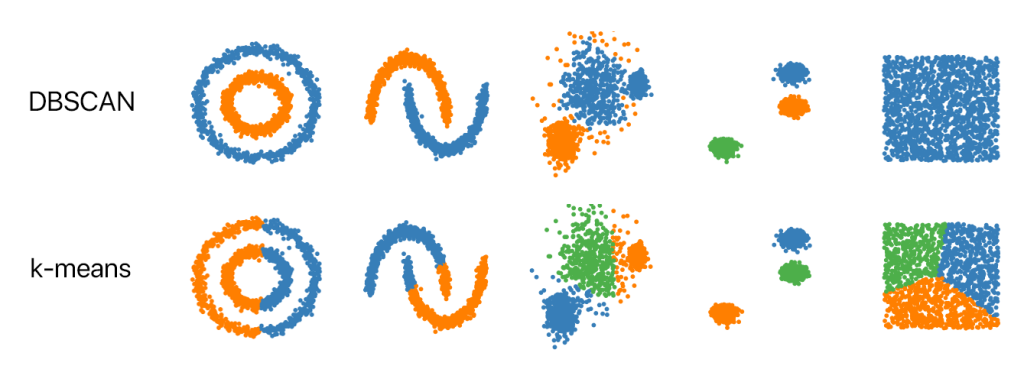
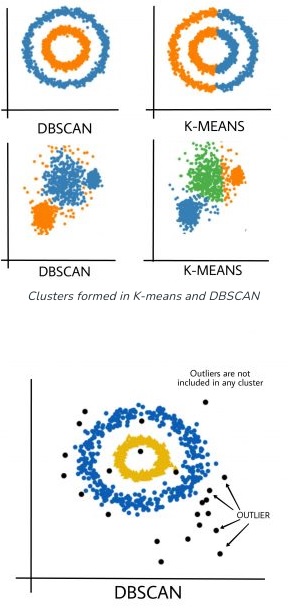
Image Source: analyticsvidhya.com
Why DBSCAN?
Real-world data may contain irregularities and noise, or clusters can be of arbitrary shape such shown in the figure above. Partitioning methods such as K-means or PAM clustering and hierarchical clustering work for finding spherical-shaped clusters or convex clusters. In other words, they are suitable only for compact and well-separated clusters. They are also severely affected by the presence of noise and outliers in the data.
DBSCAN Algorithm Parameters
- Epsilon
- The radius of the neighborhood around a datapoint i.e. if the distance between two points is lower or equal to epsilon (‘eps’) then they are considered as neighbors. If the eps value is chosen too small, then a large part of the data will be considered as an outlier or noise. If it is chosen very large, then the clusters will merge and the majority of the datapoints will be in the same clusters.
- MinPts
- The minimum number of datapoints required to be within the ϵ-radius of a given point. The larger the dataset, the larger value of MinPts must be chosen. As a general rule, the minimum MinPts can be derived from the number of dimensions in the dataset.
- Distance Function
- DBSCAN uses Euclidean distance by default. The choice of distance function is tightly linked to the choice of epsilon value and has a major impact on the outcomes. Hence, the distance function needs to be chosen appropriately based on the dataset.
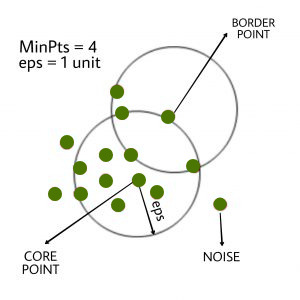
DBSCAN algorithm differentiates between three types of datapoints based on its main parameters.
- Core Point
- Just with a condition a datapoint can classify as core point. The condition is the number of neighbors including itself must be greater than or equal to our threshold min_samples.
- Border Point
- A datapoint has less than the number of neighbors in its neighborhood and it is in the neighborhood of another core point. So, this datapoint is a boundary or border point.
- Noise Point
- Definition of noise point is very simple. If any datapoint that is not a core or border point, then it is called a noise point.
How does DBSCAN algorithm work?
- Classify the points
- Find all the neighbor points within eps and identify the core points or visited with more than MinPts neighbors.
- Assign cluster to core point
- For each core point if it is not already assigned to a cluster, create a new cluster.
- Connect points to core point
- Find recursively all its density-connected points and assign them to the same cluster as the core point.
- Discard noise
- Iterate through the remaining unvisited datapoints in the dataset. Those datapoints that do not belong to any cluster are noise.
Evaluation Metric for DBSCAN Algorithm
Silhouette score is mainly used for evaluating clustering algorithms. Silhouette’s score is a range of -1 to 1. Score near 1 denotes the best meaning, that the datapoint is very compact within the cluster to which it belongs. Values near 0 denote overlapping clusters and the values around -1 are the worst clusters.
How to determine Epsilon and MinPts?
Honestly DBSCAN algorithm is very sensitive to its hyperparameters. So, if you change the values of epsilon and MinPts even slightly, then your algorithm can produce very different results. This is downside of this algorithm. But you can choose those values wisely if you have the proper domain knowledge.
How to choose MinPts?
Generally, the rule for taking min points is, you should always take your min points to be greater or equal to the dimensionality of your dataset. Typically, people who work more with DBSCAN take min point twice of the dimensionality of data.
How to determine eps?
Once you choose your min point, you can proceed with the epsilon.
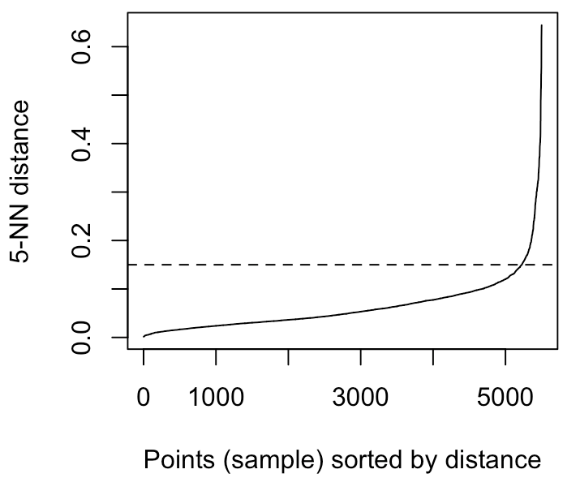
Let us choose a min point = 5, for each point I’ll compute distance. where distance from point to the 5th nearest neighbor of point. If distance is high, then the chance of point is noisy is also high.
So, you will have an array and the Ith entry in that array will represent the distance of the 5th neighbor of the Ith datapoint. then sort this array and plot it. On the y axis, you will just have the distance and on the x-axis, you will have the index (i).
Advantages of DBSCAN
- It can be used for every clustering application.
- It is very useful when the number of clusters is not known before and must be found intuitively.
- It works very well for arbitrarily shaped clusters as well as detecting noise.
Disadvantages of DBSCAN
- If your dataset has varying densities, DBSCAN does not work well in such cases.
- It also performs poorly on multidimensional data due to difficulty in estimating eps.
- It’s extremely sensitive to its hyperparameters. slight change in hyperparameters can lead to a drastic change in the results.
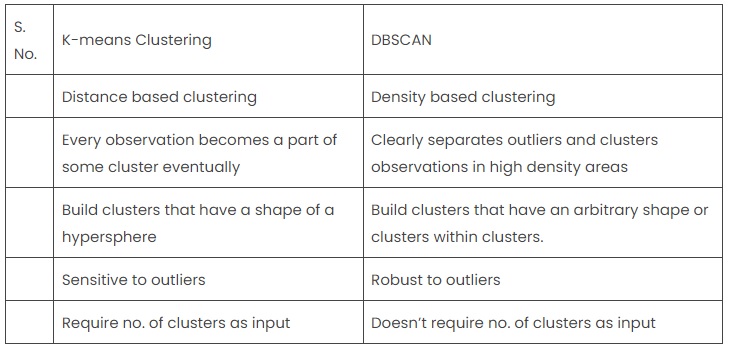
DBSCAN vs K-Means
DBSCAN and K-Means are both clustering algorithms that group together data that have the same characteristic. However, they work on different principles and are suitable for different types of datasets.
It is recommended for you:

MOST COMMENTED
Tutorial
Important Methods in Matplotlib
Machine Learning
Bias and Variance Tradeoff Machine Learning
Tutorial
Multiclass and Multilabel Classification
Machine Learning
Reinforcement Learning in Machine Learning
Deep Learning
Alexnet Architecture Code
Machine Learning
Machine Learning Models Explained