The more your business grows, more raw data you collect. Data about customers, products, working and more. Data analytics converts raw data into insights. It includes a range of tools and technologies to find trends. Data analytics can shape business processes, help decision-makers, and foster business growth.
Data analytics ensures data reaches to its fullest potential, help you better understand your users, customers, services. These insights help you adapt your approach for maximum efficiency and success.
In this post, we’ll explain big data analytics and explore how to use it in your organization.
What is Big Data?
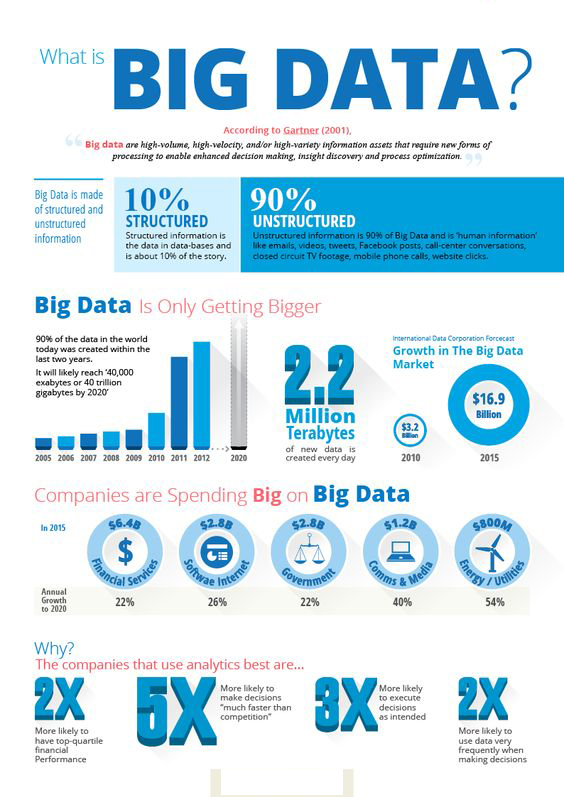
Big data refers to the large and diverse datasets that grow at increasing rates. It encompasses the volume of information, the velocity at which it is created or collected, and the variety of the datapoints being covered.
In other words, big data extracts meaningful data by analyzing the huge amount of complex, variously data generated at high speed, that cannot be handled by traditional system.
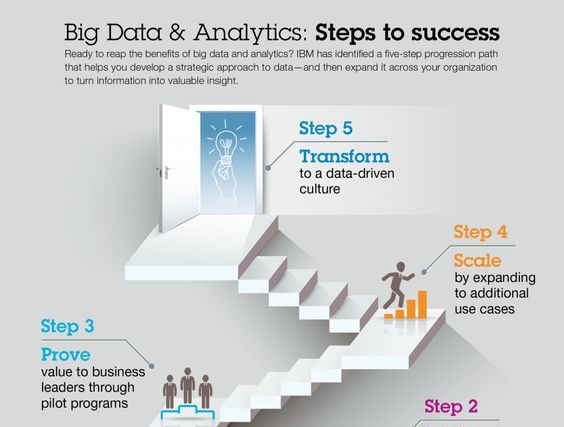
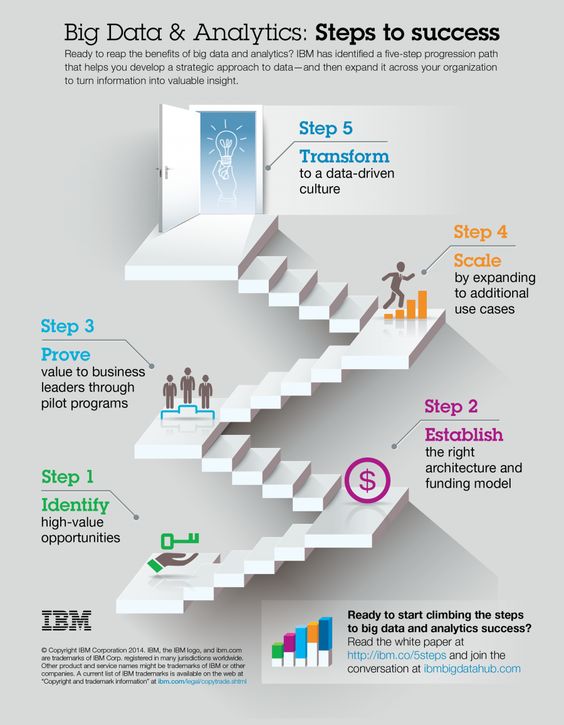
Big Data Infographic
What is Big Data Analytics?
Data analytics has been around for years in the form of business intelligence and data mining softwares.
Big Data analytics is the process used to extract meaningful insights from very large and diverse big datasets that include structured, semi-structured and unstructured data, from different sources, and in different sizes from terabytes to zettabytes.
Big Data analytics provides various advantages. it can be used for better decision making, preventing fraudulent activities, among other things.
It uses several techniques, tools to process and examine meaningful information from massive datasets. Through this, you can uncover valuable insights, patterns, and trends to make informed decisions. We typically use this analytic when our dataset is too large or complicated for traditional data processing systems.
Benefits of Big Data Analytics
- Risk Management
- Organizations use it analytics to identify fraudulent activities. The organizations leverage it to narrow down root causes of problems.
- Development and Innovations
- Large manufacturers use it to analyze how efficient the product design is and if there is any need for improvements.
- Better Decision Making
- companies leverage it to decide if a particular location would be suitable for a new outlet or not. They will analyze different factors, such as population, demographics, accessibility of the location, and more.
- Improve Customer Experience
- Every business can use it to improve customer experiences. They monitor feedback to find out their customers’ experience what’s necessary to remedy the situation.
- Business Transformation
- MIT sloan management survey report, 57 percent of enterprises surveyed said their use of analytics was helping them achieve competitive advantage.
- Innovation
- This analytic help companies develop products and services that appeal to their customers, as well as helping them identify new opportunities for revenue generation.
- Increase Security
- By applying this analytic technique to security softwares, organizations can sometimes identify and thwart cyberattacks that would otherwise have gone unnoticed.
How does Big Data Analytics work?
- Collection
- Gathering data from various sources, such websites and transactions. This data can be structured, unstructured, or semi-structured.
- Store
- Storage can handle a large volume of data and provide fault tolerance.
- Preprocessing
- Preprocessing could involve handling missing values, standardizing values, remove noises, and structuring the data into a suitable format.
- Integration
- Data integration combines the data into a unified format, because they comes from various sources and in different formats.
- Processing
- Organizations use frameworks to process big data.
- Visualization
- After process visualization helps you communicate complex insights in an understandable and accessible way.
- Interpretation
- Interpret the insights gained from your analysis to draw conclusions and make data-backed decisions. These decisions impact business strategies, processes, and operations.
- Analysis result
- This is the last step of analytic, where the final results of the analysis are made available to decision makers who will take action.
It’s important to remember that big data analytics is a cycle.
Types of Big Data Analytics
There are four types. Each serves a different purpose and offers varying levels of insight.
- Descriptive analytics
- This summarizes past data into a form that you can easily read. Descriptive analytics helps you understand your current situation and make informed decisions based on historical data. It uses aggregation, data mining, and visualization techniques to understand trends, patterns, and key performance indicators.
- Diagnostic analytics
- This is done to understand what caused a problem in the first place.
Diagnostic analytics goes beyond describing past events and aims to understand why they occurred. Organizations use diagnostic analytics because they provide an in-depth insight into a particular problem.
- This is done to understand what caused a problem in the first place.
- Predictive analytics
- This technique looks into the historical and present data to make predictions of the future. It spots patterns and trends and forecasts what might happen next. It works on predicting customer trends, market trends, and so on.
- Prescriptive analytics
- This technique prescribes the solution to a particular problem. It considers various possible actions and their potential impact on the predicted event or outcome. It relies on artificial intelligence and machine learning.
Challenges
Big data analytics has immense potential, but several different obstacles can make it difficult to achieve the benefits promised.
- Data Growth
- Explosive rate of data growth is one of the challenges. According to IDC, the amount of data in the world’s servers is roughly doubling every two years.
- Making data accessible
- Handling large and diverse datasets can make organizing and accessing information challenging.
- Unstructured Data
- Unstructured data, such as messages, images, reports, audio files, videos. This unstructured data can be very difficult to search, unless you have advanced artificial intelligence capabilities.
- Maintaining quality
- Volume and variety of data can lead to inconsistencies and less accuracy. Ensuring data quality through cleansing, validation, and proper data governance helps prevent incorrect analysis and decision-making.
- Security of data
- Data security is a concern given the large volume of sensitive information collected and analyzed. Safeguarding data against breaches, unauthorized access, and cyber threats protects customer privacy and business integrity.
- Right tools
- It is recommend using a committee of professionals to evaluate data tools that integrate well together and match your business needs and goals.
Big Data Analytics Tools
The list below includes some of analytics tools.
- APACHE Hadoop
- An open-source and cross-platformframework that stores and processes big datasets. Hadoop can handle and analyse structured and unstructured data. It can process both structured and unstructured data from one server to multiple computers.
- Qubole
- It’s an open-source tool in fetching data in a value of chain using ad-hoc analysis in machine learning. Qubole is a data lake platform that offers end-to-end service with reduced time and effort which are required in moving data pipelines.
- Spark
- An open-source cluster computing framework for real-time processing and data analysis.
- Stream analytics tools
- Systems that filter, aggregate, and analyse data that might be stored in different platforms and formats, such as Kafka.
- Cassandra
- Cassandra is an open-source NoSQL database that is used to fetch large amounts of data. It is used by many companies due to its high scalability and availability without compromising speed and performance.
- Data Pine
- Data pine is an analytical used for BI. it’s mainly used for data extraction for small or medium companies fetching data for close monitoring.
- Data mining tools
- Programs that allow users to search within structured and unstructured big data.
- NoSQL databases
- Non-relational databases are ideal for dealing with unstructured data. For example Mongo DB, it uses collections and documents for storage and its document consists of key-value pairs which are considered a basic unit of Mongo DB.
- Data warehouse
- Storage for large amounts of data collected from many different sources, typically using predefined schemas.
Big Data Analytics Techniques
- Sensor data analysis
- This is the examination of data generated by sensors. It is used for predictive machine maintenance and other processes where machines generate data.
- Genetic Algorithms
- This involves creating a population of potential solutions and evolving them over generations to find the best one.
- Machine Learning
- This covers various algorithms to learn patterns from data and make predictions.
- Clustering
- An unsupervised machine learning technique in which datapoints are grouped into clusters based on similarity. It’s mostly used for customer segmentation and anomaly detection.
- Regression Analysis
- It models the relationship between dependent and independent variables. It’s commonly used for predicting numerical values.
- Neural Networks
- Inspired by the brain’s structure and consist of interconnected nodes known as neurons and organized into layers.
- Text Mining Algorithms
- Focused on processing and understanding human language. Text mining is used to identify trends in text data such as emails, tweets, research, posts. It can be used for sorting news content, customer feedback, and client emails.
- Dimensionality Reduction
- These techniques reduce the number of features while preserving essential information.
Infographic
Recommended for you:

MOST COMMENTED
Tutorial
Important Methods in Matplotlib
Machine Learning
Bias and Variance Tradeoff Machine Learning
Tutorial
Multiclass and Multilabel Classification
Machine Learning
Reinforcement Learning in Machine Learning
Deep Learning
Alexnet Architecture Code
Machine Learning
Machine Learning Models Explained