The hierarchical clustering is an unsupervised Machine Learning algorithm that aims to find nested groups of the data by building the hierarchy. Hierarchical clusters are generally represented using the hierarchical tree known as a dendrogram.
In this post we will discuss hierarchical clustering and how we can use it to identify clusters in a set of customer data.
What is Dendrogram?
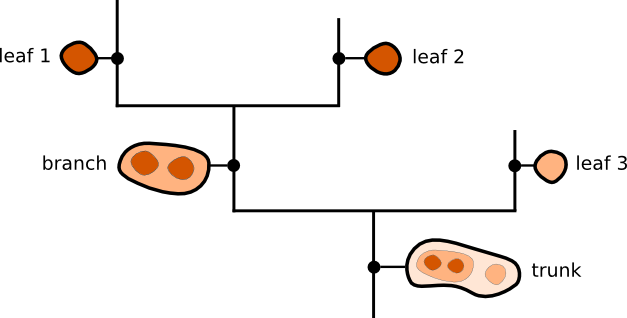
Dendrogram is a diagram that depicts a tree. Dendrogram plots are often used in computational biology to depict gene or sample grouping, occasionally in the margins of heatmaps.
Dendrogram is composed of two structures: branches, which are structures which split into multiple sub-structures, and leaves, which are structures that have no sub-structure. Branches can split up into branches and leaves, which allows hierarchical structures to be adequately represented, and the trunk is used to refer to a structure that has no parent structure.
What is Hierarchical Clustering?
It is a method of clustering analysis that aims to build a hierarchy of clusters. It creates a tree-like diagram called dendrogram, which shows the relationships between clusters. There are two types of hierarchical clustering:
- Agglomerative
- This is a bottom-up approach in which each data point is treated as a single cluster at the outset. The algorithm iteratively merges the most similar pairs of clusters until all data points are in a single cluster.
- Divisive
- This is a top-down approach in which all data points are treated as a single cluster at the outset. The algorithm iteratively splits the cluster into smaller and smaller subclusters until each data point is in its own cluster.
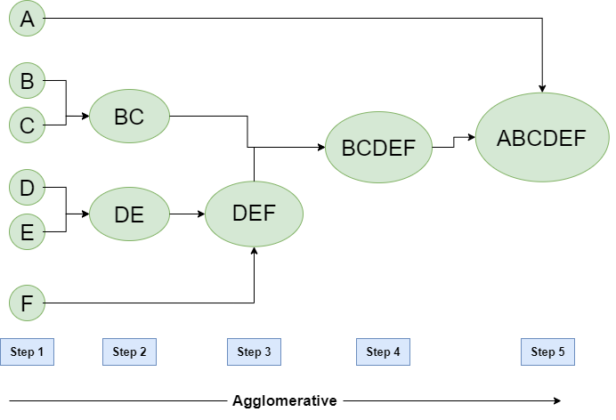
Agglomerative Clustering
The idea is to initially treat each datapoint in a dataset as its own cluster and then combine the points with other clusters as the algorithm progresses. The process of agglomerative clustering can be broken down into the following steps:
- Start with each datapoint in its own cluster.
- Calculate the similarity between all pairs of clusters.
- Merge the two most similar clusters.
- Repeat steps 2 and 3 until all the datapoints are in a single cluster or until a predetermined number of clusters is reached.
There are several ways to calculate the similarity between clusters, including using measures such as the Euclidean distance, cosine similarity, or the Jaccard index. The specific measure used can impact the results of the clustering algorithm.
This produces a tree-based representation of datapoints called Dendrogram that we discussed above.
Parameters of Agglomerative Clustering
The agglomeration hierarchical clustering can have multiple variations depending on affinity and linkage.
Affinity
Affinity denotes the method using which the distance or similarity between datapoints or clusters is calculated. The common ones are Euclidean, Manhattan Cosine.
Linkage
The clusters are formed by using different types of criteria or knowns as linkage functions. Linkage methods use the affinity that we discussed above. The different linkage methods produce different results of hierarchical clustering, they are Single, Complete, Average, Wards.
Divisive Hierarchical
Divisive hierarchical clustering is not used so much in solving real problems. It works in the opposite way of agglomerative clustering. In this, we start with all the datapoints as a single cluster. At each iteration, we separate the farthest datapoints which are not similar until each datapoint is considered as an individual cluster. Here we are dividing the single clusters into n clusters, therefore the name divisive clustering.
It takes a top-down approach where the entire data is considered to be one big cluster at the start. Then subsequently it is split into two, then three clusters, and so on until each data ends up as a separate cluster.
Dendrogram Interpretation
Each level of dendrogram has a meaning to the relationship between its datapoints. In a regular relationship chart, one may interpret that at the top lies the first generation, next level corresponds to second generation and final level belongs to third generation. Likewise, in every branching procedure of dendrogram, all the datapoints having the membership at each level belongs to a certain class.
However, to infer this class entity, one has to go through a few individual samples of each level within the formulated cluster and find out what feature is common in the resulting cluster.
Also, these inferred classes need not be similar at the same branches. For example, in level 2, the cats have been clustered on big ears and calm behavior, but dogs have been clustered on a similar attribute of size.
Advantages
- With hierarchical, you can create more complex shaped clusters that aren’t possible with Gaussian Mixture Models, and you don’t need make any assumptions of how the resulting shape of your cluster should look like.
- You can cluster dataset at various levels of granularity, and then decide upon the number of clusters you desire in your dataset.
- If you are using minkowski distance to measure the distance between your clusters, then mathematically, your clustering procedure can become very easy to understand.
Disadvantages
- Hierarchical clustering is heavily driven by heuristics. This leads to a lot of manual intervention in the process and consequently, domain-specific knowledge is required to analyze whether the result makes sense or not.
- It is a mathematically heavy algorithm. In any hierarchical clustering algorithm, you have to keep calculating the distances between datapoints and it increases the number of computations required.
- If the number of datapoints increases, then visually analyzing dendrogram and making decisions becomes impossible.
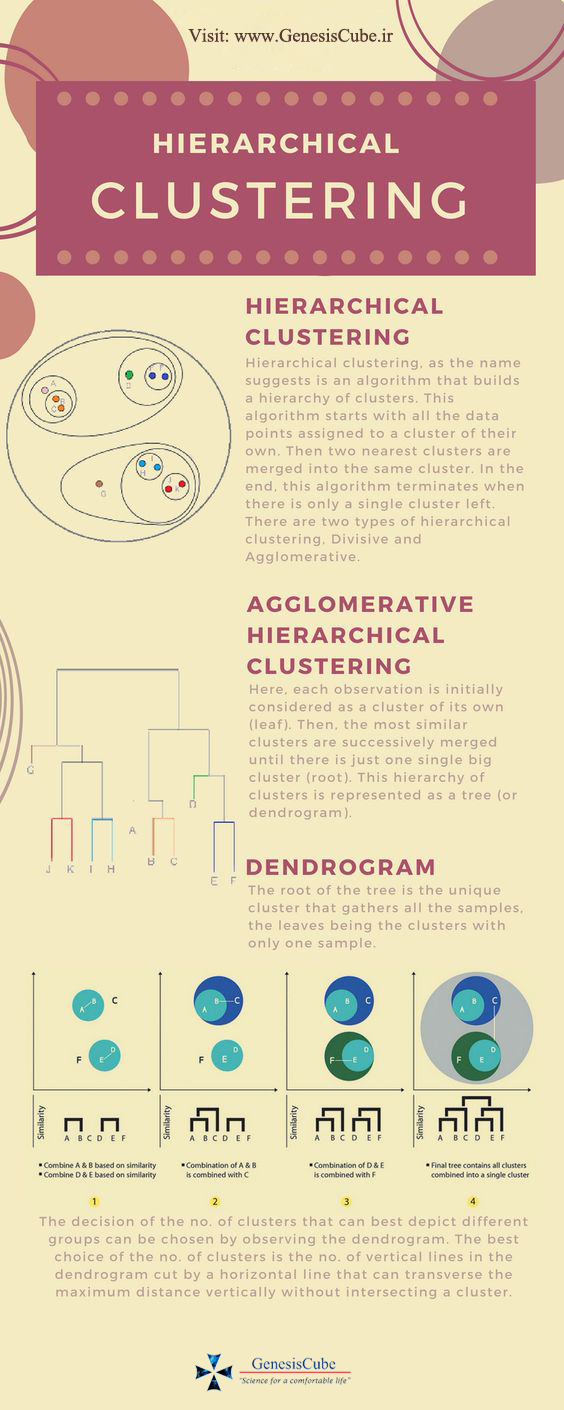
Hierarchical Clustering Infographic
Recommended to you:
Density-Based Clustering
Text Mining Algorithms

MOST COMMENTED
Tutorial
Important Methods in Matplotlib
Machine Learning
Bias and Variance Tradeoff Machine Learning
Tutorial
Multiclass and Multilabel Classification
Machine Learning
Reinforcement Learning in Machine Learning
Deep Learning
Alexnet Architecture Code
Machine Learning
Machine Learning Models Explained