


To make necessary statistical inferences, it becomes essential to visualize your data, and Matplotlib is a package for Python users. Matplotlib is a comprehensive library for creating static, animated, and interactive visualizations in Python.
What is Matplotlib ?
Matplotlib is an open-source drawing library that supports various drawing types. You can generate plots, histograms, bar charts, and other types of charts with just a few lines of code.
This article is a beginner to intermediate level.
Data Visualization
Data visualization provides an excellent approach for exploring the data, which is essential for presenting results. Data visualization is a term, it expresses the idea that involves more than just representing data in the graphical form instead of using textual form.
This can be very helpful when discovering and getting to know a dataset and can help with classifying patterns, corrupt data, outliers, and more. With a little domain knowledge, data visualizations can be used to express and demonstrate key relationships in plots.
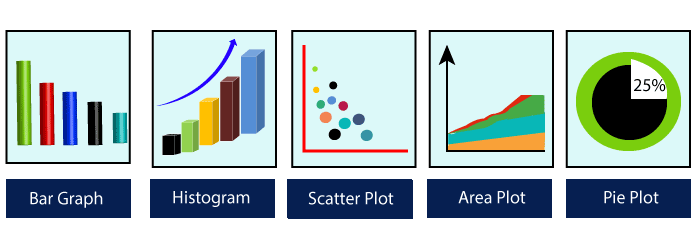
There are five key plots that are used for data visualization.
Data Visualization Benefits
Data visualization can perform below tasks:
- Identify areas that need improvement and attention.
- clarify the factors.
- help to understand which product to place where.
- Predict sales volumes.
Here are some data visualization benefits.
- Building ways of absorbing information
- Data visualization allows users to receive vast amounts of information regarding business conditions. It helps decision-makers to see the relationship between multi-dimensional data sets. It offers new ways to analyses data through the use of maps, fever charts, and other rich graphical representations.
- Visualize relationship in Businesses
- The crucial advantage of data visualization is that it is essential to find the correlation between business performance in today’s highly competitive business environment. The ability to make these types of correlations enables the executives to identify the root cause of the problem and act quickly to resolve it.
- Take action on the emerging trends faster
- Data visualization allows the decision-maker to grasp shifts in market conditions across multiple data sets efficiently. Having an idea about the customer’s sentiments and other data discloses an emerging opportunity for the company to act on new business opportunities ahead of their competitor.
- Geological-based Visualization
- Geospatial visualization is occurred due to many websites providing web services, attracting visitor’s interest. These types of websites are required to take benefit of location-specific information, which is already present in the customer details.
- Create publication quality plots.
- Make interactive figures that can zoom, pan, update.
- Customize visual style and layout.
- Export to many file formats.
- Embed in JupyterLab and Graphical User Interfaces.
- Use a rich array of third-party packages built on Matplotlib.
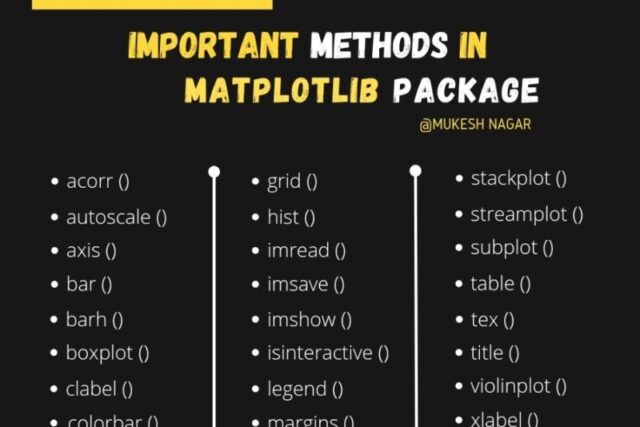
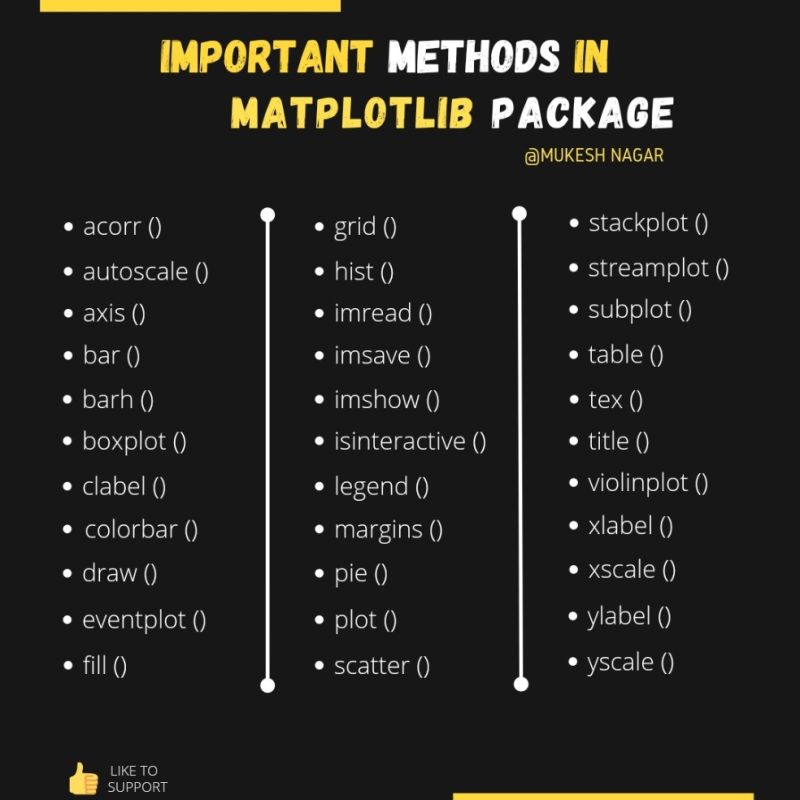
Matplotlib Cheat Sheet
Recommended for you:
Tutorial
Yes! Finally someone writes about binary options.
I join. All above told the truth. We can communicate on this theme.