For a data scientist, it is very important to know whether the dataset is linear or not. Because linear and non-linear are two types of classification models used in machine learning modeling.
A linear model plots features and their associated outcomes on a hyperplane. Non-linear models are more complex and do not have a straight line. They have complex boundaries.
Neural network is an example of a nonlinear modeling. Also, you will learn techniques for determining whether your dataset is linear or non-linear.
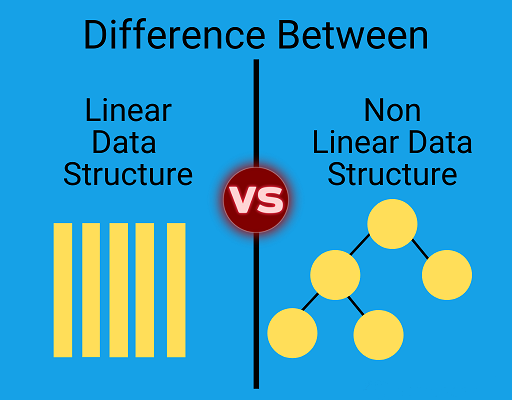
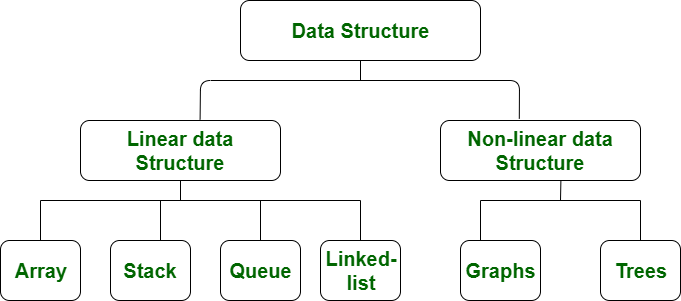
What is Linear Data Structure?
Linear data structure is one in which datapoints are ordered sequentially, with each member attached to its previous and next neighboring points. Since the datapoints are stored in a linear fashion, therefore, we can traverse all the points in single run only. Its examples are array, stack and linked list.
Linear Data Structure Properties
- In a linear structure, the elements are arranged sequentially or linearly.
- Each datapoint is attached to the previous and next point.
- As linear data structure is a single level, so it requires a single run to traverse each datapoint.
- Implementation is easier than non-linear data structure.
- In a linear data structure, memory is not utilized in an efficient way.
- Linear data structures are mainly used for software developing.
- The time complexity of linear data structure increases with the increase in the input size.
- Performance is usually good for simple operations like adding the elements, but slower for operations like searching or removing elements.
What is Nonlinear data structure?
Data structures where datapoints are not arranged sequentially are called non-linear data structures and have a more complex relationship with each other.
Unlike linear data structures they do not follow a linear progression or a simple order, therefore, we can’t traverse all the elements in single run only.
Non-linear data structures are used when data needs to be organized in a more complex relationships, such as in hierarchical structures or graph-based data.
Nonlinear Data Structure Properties
- In nonlinear structure, datapoints are arranged hierarchically.
- Each point is attached to many other points.
- In non-linear data structure, the datapoints are arranged in multiple levels.
- Implementation is more complex than linear data structure.
- Memory is utilized in a very efficient manner.
- In nonlinear data structure, datapoints can’t be traversed in a single run only.
- Non-linear data structures are mainly used in image processing.
- The time complexity of non-linear data structure often remains same with the increase in the input size.
- Performance depends on operation but can be optimized for specific operations.
Difference between Nonlinear and Linear
- The main difference between nonlinear and linear models is their flexibility for curve-fitting. While linear systems are generally easy to train and understand, nonlinear systems require much more effort in selecting starting values and optimizing their fit.
- A nonlinear model is useful when the relationship between the variables and the model isn’t linear. This model offers the greatest flexibility in curve-fitting.
- To simulate complex systems, a nonlinear model can be used. This type of model is not only more accurate but also more effective than a linear model.
- The nonlinear model is more flexible that its counterpart, but it requires a lot of work on the algorithm’s part.
- Nonlinear models can also be used to describe nonlinear relationships between variables. In this models, the dependent variable is modeled as a function of the independent variables.
- There are two main types of algorithms for nonlinear regression: Naive Bayes, decision tree.
| Non-Linear Data Structure | Linear Data Structure |
| Datapoints are connected hierarchically. | Datapoints are ordered in sequential order. |
| Performance depends on structure and the operation. | Performance is slow for operations like searching or removing points in the middle. |
| It is useful for representing complex relationships and data hierarchies, such as file systems. | It is useful for simple data storage and manipulation. |
| Datapoints need to traverse in a multiple run. | Datapoints can be traversed in a single run only. |
| Multiple levels are involved. | Just single level is involved. |
Techniques for determining Data Structure
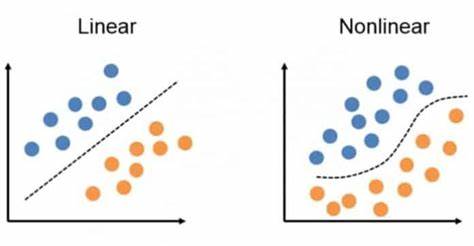
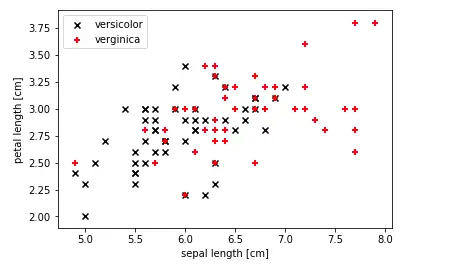
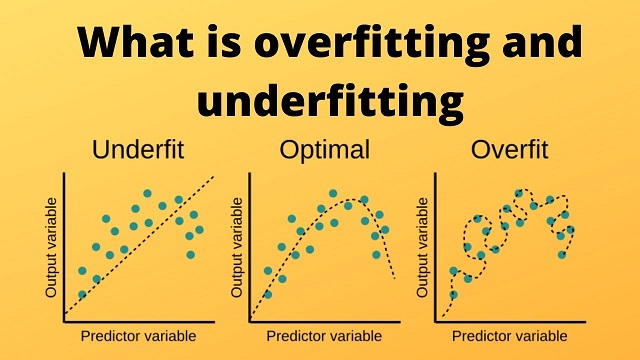
- Use Scatter Plots
- A simple way to find out whether data is linear or non-linear in the classification problem is draw 2D scatter plots representing different classes. Figure represents the linearly and non-linearly separable dataset.
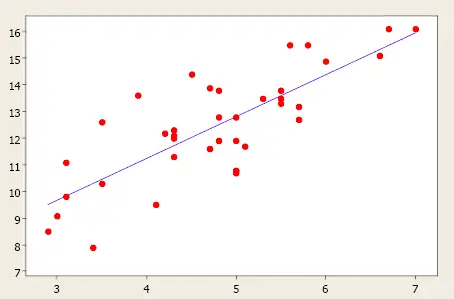
- Use Simple Regression
- Linear data can be represented on a line graph, because there is a clear relationship between variables and the graph will be a straight line. But non-linear data cannot be represented on a line graph. This is because there is no clear relationship between the variables. As the result graph will be curved.
- Use Square Error
- When you are dealing with prediction of numerical value check the least square error. If the least square error shows high accuracy, dataset is linear in nature, else the dataset is non-linear.
Hope you found this post useful. Feel free to share your feedback.
Recommended for you:
Bagging vs Boosting in Machine Learning
Concepts of Data Science
Thick Data vs Big Data
MOST COMMENTED
Tutorial
Important Methods in Matplotlib
Machine Learning
Bias and Variance Tradeoff Machine Learning
Tutorial
Multiclass and Multilabel Classification
Machine Learning
Reinforcement Learning in Machine Learning
Deep Learning
Alexnet Architecture Code
Machine Learning
Machine Learning Models Explained