
Selecting the right metric for a specific model, is the key to be able to measure the performance of the model objectively and in the right setting.
In this post, we explore the different metrics that every Data Scientist should know and master, to be able to apply the most appropriate metric to each task.
Performance Metrics in Machine Learning
Evaluating the performance of a Machine learning model is one of the important steps while building an effective machine learning model. To evaluate the performance or quality of the model, different metrics are used, and these metrics are known as performance metrics or evaluation metrics. These performance metrics help us understand how well our model has performed for the given data. In this way, we can improve the model’s performance by tuning the hyper-parameters. Each machine learning model aims to generalize well on unseen or new data, and performance metrics help determine how well the model generalizes on the new dataset.
In machine learning, each task or problem is divided into classification and Regression. Not all metrics can be used for all types of problems; hence, it is important to know and understand which metrics should be used. Different evaluation metrics are used for both Regression and Classification tasks.
Types of Machine Learning Metrics
There are various metrics out there to evaluate machine learning models in different applications. Most of them can be put into two categories based on the types of predictions in machine learning models.
Classification is a prediction type used to give the output variable in the form of categories. For example, such models can provide binary output such as sorting spam and non-spam messages.
Regression is a prediction type where the output variable is numerical and continuous. For example, it can help with predicting a patient’s length of stay in a hospital.
Classification Evaluation Metrics
Classification evaluation metrics score generally indicates how correct we are about our prediction. The higher the score, the better our model is. Before diving into the evaluation metrics for classification, it is important to understand the confusion matrix.
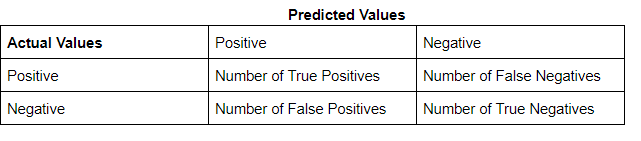
Confusion Matrix Metric
A confusion matrix is a technique for summarizing the performance of a classification algorithm. A few terms associated with the confusion matrix are:
- True positive: An instance for which both predicted and actual values are positive.
- True negative: An instance for which both predicted and actual values are negative.
- False Positive: An instance for which predicted value is positive but actual value is negative.
- False Negative: An instance for which predicted value is negative but actual value is positive.
Accuracy Metric
Accuracy can be defined as the percentage of correct predictions made by our classification model. The formula is:
Accuracy = Number of Correct predictions / number of rows in data
or
Accuracy = (TP+TN) / number of rows in data
Accuracy is a good metric to use when the classes are balanced, i.e proportion of instances of all classes are somewhat similar. However, it is to be noted that accuracy is not a reliable metric for datasets having class imbalance, i.e The total number of instances of a class of data is far less than the total number of instances for another class of data. it’s better to check our performance on other metrics before concluding our model’s performance.
Precision Metric
Precision indicates out of all positive predictions, how many are actually positive. It is defined as a ratio of correct positive predictions to overall positive predictions.
Precision = Predictions actually positive / Total predicted positive.
Precision = TP / TP+FP
Recall Metric
Recall indicates out of all actually positive values, how many are predicted positive. It is a ratio of correct positive predictions to the overall number of positive instances in the dataset.
Recall = Predictions actually positive / Actual positive values in the dataset.
Recall = TP / TP+FN
Regression Evaluation Metrics
Regression is a supervised learning technique that aims to find the relationships between the dependent and independent variables. A predictive regression model predicts a numeric or continuous value. The metrics used for regression are different from the classification metrics. It means we cannot use the Accuracy metric to evaluate a regression model; instead, the performance of a Regression model is reported as errors in the prediction.
Mean Squared Error
There can be instances where large errors are undesirable. Let’s say that one of the predictions of a model is an outlier. In this case, we should penalize this higher error to a greater extent. Which is where we can use mean squared error.
The average of the sum of squares of differences between the predicted and actual values of the continuous target variable.
MSE = Σ (y_actual – y_predicted)2 / n
Mean Absolute Error
As the name suggests the mean absolute error can be defined as the mean of the sum of absolute differences between the predicted and actual values of the continuous target variable.
MAE = Σ | y_actual – y_predicted | / n
Root Mean Squared Error
The metric of the attribute changes when we calculate the error using mean squared error. For example, if the unit of a distance-based attribute is meters (m) the unit of mean squared error will be (m2), which could make calculations confusing.
In order to avoid this, we use the root of mean squared error.
RMSE = √MSE = √ Σ (y_actual – y_predicted)2 / n
Recommended for you:


MOST COMMENTED
Tutorial
Important Methods in Matplotlib
Machine Learning
Bias and Variance Tradeoff Machine Learning
Tutorial
Multiclass and Multilabel Classification
Machine Learning
Reinforcement Learning in Machine Learning
Deep Learning
Alexnet Architecture Code
Machine Learning
Machine Learning Models Explained