Regression analysis is a common statistical method mainly used in economic. There are several main reasons people use regression analysis:
- To predict future economic conditions and trends.
- To determine the relationship between two or more variables.
- To understand how one variable change when another changes.
There are many different regression analyses. For the purpose of this post, we will look linear and multiple regression.
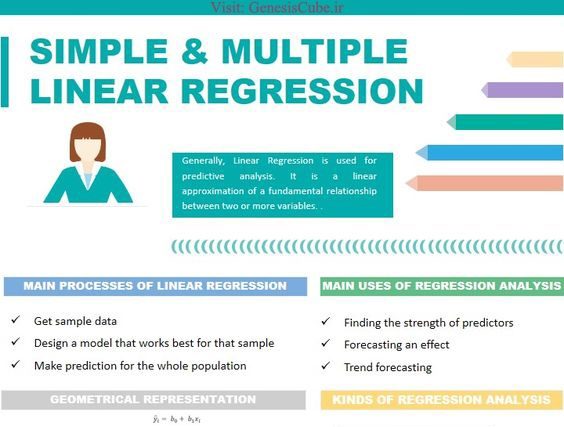
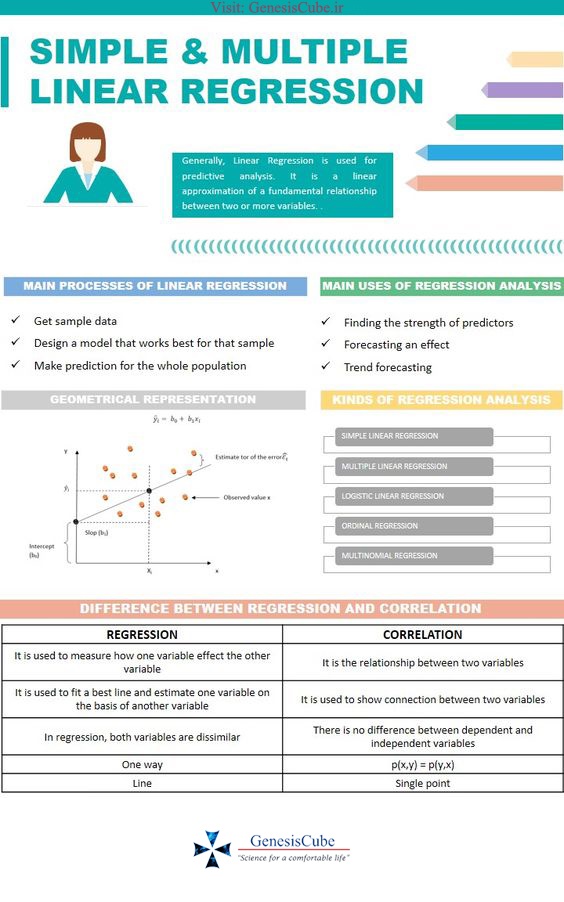
Regressions Analysis
Regression analysis is a common statistical method used in finance. Linear regression is one of the most common techniques of regression analysis. Multiple regression is a broader class of regressions that encompasses linear and nonlinear regressions with multiple explanatory variables.
Regression helps pool data together for helping companies make informed decisions.
There are different variables at play in regression, including a dependent variable that you’re trying to understand and an independent variable that may have an impact on the dependent variable.
Regression analysis is used for two conceptually distinct purposes.
- First, regression analysis is widely used for forecasting, where its use has substantial overlap with machine learning.
- Second, regression analysis can be used to infer relationships between the independent and dependent variables.
Note, regressions only reveal relationships between a dependent variable and a collection of independent variables in a fixed dataset.
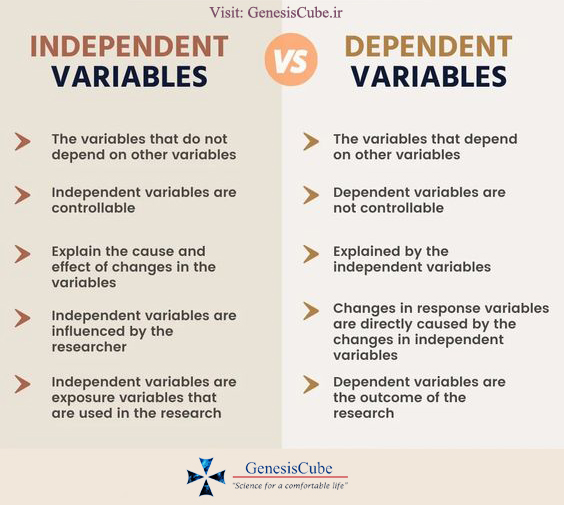
What is dependent and independent variable?
Dependent Variable
Dependent variable is what you record after you’ve manipulated the independent variable. Dependent variable depends on your independent variable, because this variable changes as a result of the changes to the independent variables.
Independent Variable
Independent variables are the variables that you include in machine learning model to predict changes in dependent variable.
These variables are independent, because whose change isn’t affected by any other variable in the experiment.
Uses of Regression Analysis:
- To predict future economic conditions, trends, or values.
- To determine the relationship between two or more variables.
- To understand how a variable change when another changes.
Simple Linear Regression
Simple linear regression also called simple regression is a statistical method that allows us to study the relationships between two continuous variables.
Simple linear regression is used when we have one variable X that we want to use to explain the response variable Y.
It is graphically depicted using a line with the slope defining how change in one variable impacts a change in the other.
In order to pick the best fitting line, we need to establish a fitting measurement that will tell us how good or bad our line fits the data.
Measurements that measure the performance of a model are called Loss functions.
In a linear regression problem, a good fitting measurement is to take the distance between the predicted Y value using the fitting line and the Y true value from our data, square the result in order to get positive values, and compute the summation for all datapoints.
If the relationship between two variables does not follow a straight line, nonlinear regression is used instead. Linear and nonlinear regression are similar in that both track a particular response from a set of variables.
As the relationship between the variables becomes more complex, nonlinear models have greater flexibility of depicting the non-constant slope.
Multiple Linear Regression
In Multiple Linear Regression our model has more than two predictors.
Multiple linear regression settings have potentially large number of predictors. It is more efficient to use matrix to define the regression model and the subsequent analyses.
Simple and multiple linear regression have similar line assumptions. Difference is that whereas in simple linear regression we think of the distribution of errors at a fixed value of single predictor, with multiple linear regression we have to think of a distribution of errors at a fixed set of values for all the predictors.
In Multiple linear regression, we have a set of predictor variables X₁, X₂, …, that we want to use to explain the response variable Y.
Interpret Multiple Regression
Interpretation of the context of multiple linear regression remains the same. However, with multiple linear regression, we can also make use of an adjusted value, which is useful for machine learning model building.
When should we use Multiple Linear Regression?
- It should be used when multiple independent variables determine the outcome of a single dependent variable.
- How strong the relationship is between two or more independent variables and one dependent variable.
- The value of the dependent variable at a certain value of the independent variables.
Is Multiple Linear Regression better than Simple Linear Regression?
Multiple linear regression is a more specific calculation than simple regression. For straight-forward relationships, simple linear regression may easily capture the relationship between the two variables.
For more complex relationships multiple linear regression is often better.
Multiple linear regression should be used when multiple independent variables determine the outcome of a single dependent variable. This is often the case when forecasting more complex relationships.
In Summary
- Regression analysis is a common statistical method used in finance.
- Simple regression is most common techniques of regression analysis when there are only two variables.
- Multiple regression is a broader class of regressions that encompasses linear and non-linear regressions with multiple explanatory variables.
- Each independent variable in multiple regression has its own coefficient to ensure that each variable is weighted appropriately.
Multiple Linear Regression and Simple Linear Regression Infographic
We are always open to your questions and suggestions.
You can share this post on LinkedIn, Facebook, Twitter, so someone in need might stumble upon this.
Recommended for you:
Best Metric for Regression
How KNN works
Top Machine Learning Algorithms
MOST COMMENTED
Tutorial
Important Methods in Matplotlib
Machine Learning
Bias and Variance Tradeoff Machine Learning
Tutorial
Multiclass and Multilabel Classification
Machine Learning
Reinforcement Learning in Machine Learning
Deep Learning
Alexnet Architecture Code
Machine Learning
Machine Learning Models Explained