
Standard deviation measures the dispersion of a dataset relative to its mean and is calculated as the square root of the variance. Standard deviation is calculated as the square root of variance by determining each data point’s deviation relative to the mean.
If the data points are further from the mean, there is a higher deviation within the dataset; thus, the more spread out the data, the higher the standard deviation.
Standard deviation is also an excellent way to identify outliers or noises in dataset. Data points that lie more than one standard deviation from the mean can be considered unusual. In many cases, data points that are more than two standard deviations away from the mean are not considered in analysis.
We can ask question “how many sigmas away from the mean is this data point?” for find how extreme a data point is.
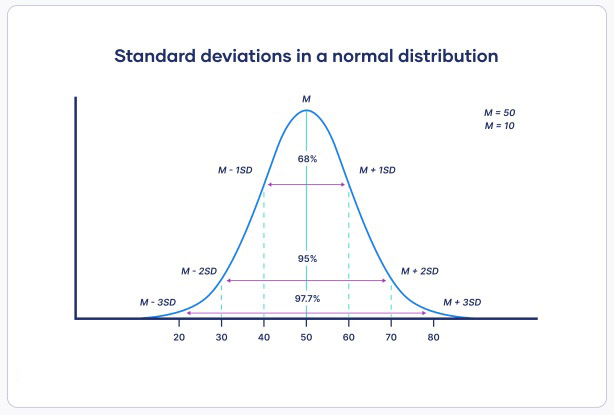
image source: www.scribbr.com
Standard Deviation in Finance
Standard deviation is a statistical measurement in finance that, when applied to the annual rate of return of an investment, sheds light on the volatility of an investment.
The greater the standard deviation of securities, the greater the variance between each price and the mean, which shows a larger price range. For example, a volatile stock has a high standard deviation.
Advantages of Standard Deviation
Standard deviation is all-inclusive of observations. Each data point is included in the analysis. Other measurements of deviation such as range only measure the most dispersed points without consideration for the points in between. Therefore, standard deviation is often considered a more robust, accurate measurement compared to other observations. In addition, the standard deviation can be used in further algebraic computations.
Disadvantages of Standard Deviation
The standard deviation does not actually measure how far a data point is from the mean. Instead, it compares the square of the differences, a subtle but notable difference from actual dispersion from the mean.
Outliers and noises have a heavier impact on standard deviation. This is especially true considering the difference from the mean is squared, resulting in an even larger quantity compared to other data points. Therefore, be mindful that standard observation naturally gives more weight to extreme values.
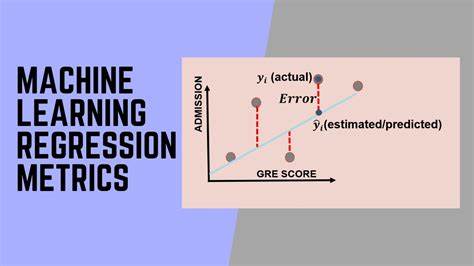
Used Standard Deviation in Machine Learning
Using standard deviation to calculate the variability of a population or sample is a crucial test of a machine learning model’s accuracy against real data. In addition, it can be used to measure confidence in a model’s statistical conclusions.
The Formula of Standard Deviation
The formula for standard deviation (std) is
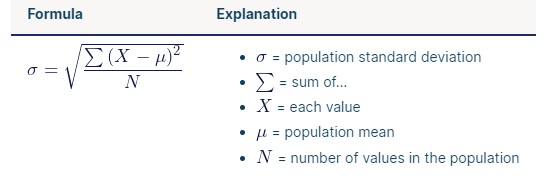
- Find the mean.
- Find the square of each data point’s distance to the mean.
- Sum the values from step 2.
- Divide by the number of data points.
- Take the square root.
Summary
- Standard deviation measures the dispersion of a dataset relative to its mean.
- It is calculated as the square root of the variance.
- It is often used as a measure of a relative riskiness of an asset.
- As a disadvantage, it calculates all uncertainty as risk, even when it’s in the investor’s favor such as above average returns.
Recommended for you:
Concepts of Data Science
Type of Distribution Statistics

MOST COMMENTED
Tutorial
Important Methods in Matplotlib
Machine Learning
Bias and Variance Tradeoff Machine Learning
Tutorial
Multiclass and Multilabel Classification
Machine Learning
Reinforcement Learning in Machine Learning
Deep Learning
Alexnet Architecture Code
Machine Learning
Machine Learning Models Explained