The technology domain has witnessed a dramatic growth in the recent past. Methodologies have changed, new ways have been adopted by companies to accomplish these desired tasks. One of the key areas, which has impacted the technology industry hard in the last three years is the data balloon, that has inflated immensely giving birth to new data analysis and mining tools, and techniques to manage it.
Data has always been an important aspect of business. Whether to make decisions or to analyze the past, data is required. Lately this requirement has bewildered the whole system. What does Big Data really mean and how does it stand apart from thick Data? Here we deep to understand the of both the terms.
Data analytics tools will be particularly useful for detecting new purchasing patterns and delivering a personalized experience to customers, in addition to better understanding of consumers new behavior.
What is Big Data?
It can refer to both a large and complex data set, as well as the methods used to process this type of data. It has four main characteristics:
- Volume:
- It is big. While big data isn’t only distinguishable by its size, it’s also typically very high volume in nature.
- Variety:
- It typically contains structured, semi-structured, and unstructured data.
- Velocity:
- It generates quickly and is often processed in real time.
- Veracity:
- It isn’t inherently better quality than traditional data, but its accuracy is extremely important. Anomalies, biases, and noise can significantly impact the quality of it.
What is Thick Data?
It is about a complex range of primary and secondary research approaches, including surveys, questionnaires, focus groups, interviews and so on. It’s the result of the collaboration between data scientists and anthropologists working together to make sense of large amounts of data. They analyze data, looking for qualitative information like insights, preferences, motivations and reasons for behaviors. It is qualitative data (like observations, feelings, reactions) that provides insights into consumers everyday emotional lives. Because thick data aims to uncover people’s emotions and models of the world they live in, it can be difficult to quantify.
Integrating Big or Thick Data
Working successfully with integrated these two, certainly enhances any risk assessment. Over the years we have found ways to integrate data from multiple sources in our risk assessments. We routinely use Incomplete Thick datasets in conjunction with expert opinion to generate first a prior estimates of the probability of occurrence of hazards and failures.
This immensely increases the value of the first cut risk assessment which can then be updated using Bayesian approaches.
That approach also makes it possible to enhance the value of Big data, avoid squandering the capital and running cost necessary to get Big Data. Without that approach, recent studies have shown, data oftentimes remain virtually “unused”.
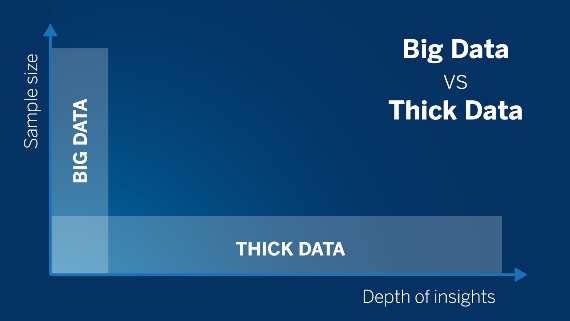
Comparison of Big Data and Thick Data
- Big-Data is quantitative, while Thick-Data is qualitative.
- Thick-Data uncovers the meaning behind Big-Data visualization and analysis.
- Big-Data reveals insights with a particular range of data points, while Thick-Data reveals the social context of and connections between data points.
- Big-Data delivers numbers; Thick-Data delivers stories.
- Big-data relies on Machine Learning; Thick-Data relies on human learning.
Thick or Big Data?
Let’s Look at an Example– You’re a big brand and you want to look at one campaign’s effectiveness– Did that limited time offer you launched in February pay off? How do you know for sure?
Big Data says you pull in store sales, while doing a variety of comparisons. This menu item versus that menu item. This store versus that store. And so on.
Thick Data says you look at what was happening in each of your individual stores during February : What were the factors that contributed to sales that aren’t visible in the Big Data numbers? Staff issues? Big events? Huge local news that caught everyone’s attention? And what was happening with the brand on social media?
One promising technology that can give us the best of both of them is affective computing.
Affective computing is the study and development of systems and devices that can recognize, interpret, process, and simulate human affects. It is an interdisciplinary field spanning computer science, psychology, and cognitive science. The machine should interpret the emotional state of humans and adapt its behavior to them, giving an appropriate response for those emotions.
Using affective computing algorithms in gathering and processing data will make the data more human and show both sides of data: quantitative and qualitative.
Recommended for you:


MOST COMMENTED
Tutorial
Important Methods in Matplotlib
Machine Learning
Bias and Variance Tradeoff Machine Learning
Tutorial
Multiclass and Multilabel Classification
Machine Learning
Reinforcement Learning in Machine Learning
Deep Learning
Alexnet Architecture Code
Machine Learning
Machine Learning Models Explained