What is distribution in statistics?
Distribution in statistics is a function that represents the possible values for a variable and how frequently they happen. Let’s take an example of a dice. It has six surfaces that are numbered from 1 to 6. We roll the dice. What is the probability of obtaining 1?
It is one out of six, thus one-sixth, right? Then, what is the probability of obtaining 2? Again – one-sixth. Okay!
This is the same for 3, 4, 5, and 6.
Now, what is the probability of obtaining a 7? Obviously, it is impossible to get a 7 while rolling a die. Consequently, the probability is 0.
| Note: The probability of universal truth is always 1, and the probability of assumptions is always 0. |
Different types of distribution in statistics
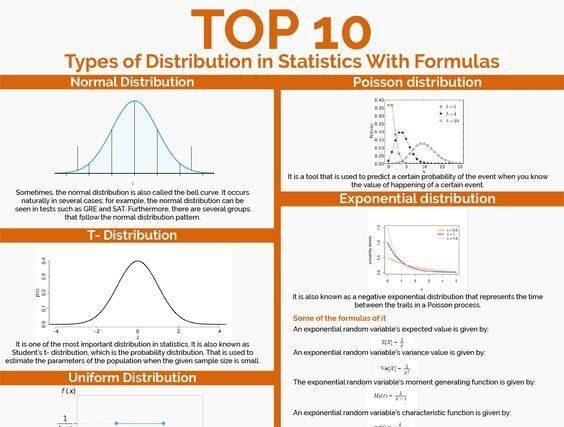
Normal Distribution
Sometimes, the normal distribution is also called the bell curve. It occurs naturally in several cases; for example, the normal distribution can be seen in tests such as GRE and SAT. Furthermore, there are several groups that follow the normal distribution pattern. Because of this, it is widely used in statistics, business, and government bodies:
- Measurement errors.
- Points on a test.
- Salaries.
- Height of people.
- Blood pressure.
- IQ scores.
Properties of a normal distribution
- The curve remains symmetric at the center.
- The area under the curve is 1.
- The mean, median, and mode are always equal.
- Exactly half value is on the left of the center and the other on the right.
T- Distribution
It is one of the most important distributions in statistics. It is also known as Student’s t- distribution, which is the probability distribution. That is used to estimate the parameters of the population when the given sample size is small and the standard deviation of the population is unknown.
Properties of t-distribution
- Like normal distribution, the student distribution has bell-shaped and symmetric with zero mean.
- The range of student distribution from – ∞ to ∞ (infinity).
- The t distribution’s shape changes with the degree of freedom.
- The variance is always more than one, and it can be represented when the degree of freedom v>=3 and given: var (t) = [v/v -2].
- It is not packed that much at the center but higher at trials; therefore, its shape is like platykurtic.
- The dispersion of t distribution is much more than the normal distribution. As the size of the sample ‘n’ increases, it is considered as a normal distribution. Here, the given sample size is taken larger than n>=30.
Uniform distribution
The basic form of a continuous distribution is known as uniform distribution. It has the constant probability that it forms a rectangular distribution. And it implies that each value has the same length of distribution. Which has an equal probability of occurrence. In contrast, this function belongs to the type of maximum entropy probability distributions.
Properties of uniform distribution
- The density function combines to unity.
- Each of its input functions has equal weightage.
Bernoulli distribution
A Bernoulli distribution is a kind of discrete probability distribution- a random trial that has two results. There is a special case that has the value n = 1, for example, a single coin toss.
Properties of Bernoulli distribution
- The number of trials that have to be performed under a single experiment must be predefined.
- Each trial must have two outcomes that are success or failure.
- The success’ probability in each experiment should be the same.
- The experiment should be independent of each other, which means the outcome of one trial is not affected by the other’s trial outcome.
Binomial distribution
A probability distribution concludes the value that takes one of two independent values under a set of assumptions or parameters. Besides, the binomial distribution’s assumptions must have a single result with the same probability of success. And that trail must be independent of each other.
Properties of a binomial distribution
- When an experiment has independent trails, each of them has two results: success and failure.
- The binomial distribution is also called as bi-parametric distribution. As it is classified by two parameters n and p.
- The mean value of this is:μ = np
- The binomial distribution’s variance is given by:σ² = npq
- The value of p and q is always less than or equal to 1, or we can say that the variance must be less than its mean value: npq < np
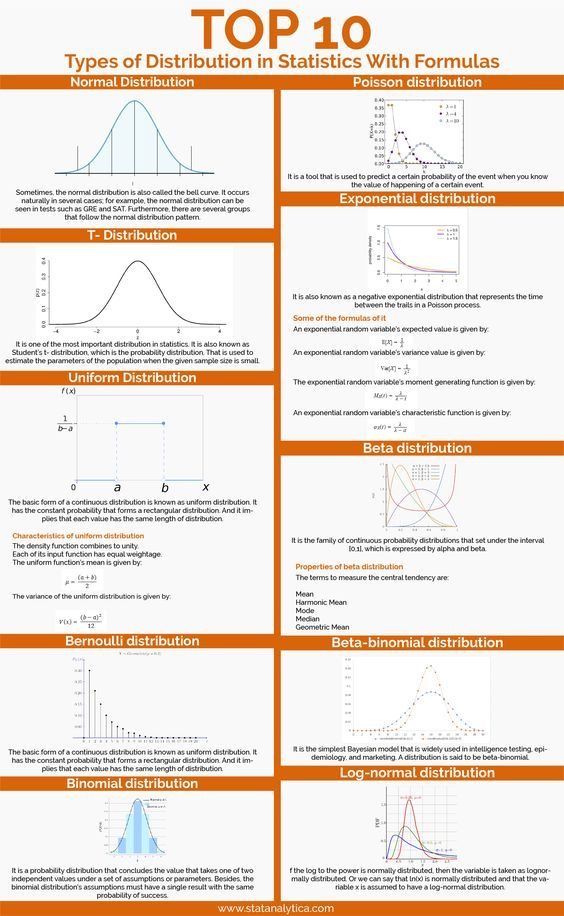
Poisson distribution
It is a tool that is used to predict a certain probability of the event when you know the value of a certain event. The Poisson distribution provides us the probability of an applied number of events that happen in a fixed period of time.
Properties of Poisson distribution
- The expected value and variance of the random variable are equivalents to λ.
- The coefficient of variance is, whereas the index dispersion is.
- The expected value of the Poisson distribution is decomposed by underlying the product of intensity and exposure.
- The mean of the Poisson distribution is given by “m”.
Exponential distribution
It is also known as a negative exponential distribution that represents the time between the trails in a Poisson process. The relationship between the exponential distribution and Poisson distribution.
Beta distribution
It is the family of continuous probability distributions that are set under the interval [0,1], which is expressed by alpha and beta. Furthermore, this model is used for the model that has an uncertainty of the success probability of a random experiment. It also offers a powerful tool with the basic statistics that can compute the confidence level of completion time.
Properties of beta distribution
There are a few properties that can satisfy these distributions are:
The terms to measure the central tendency are:
- Mean
- Harmonic Mean
- Mode
- Median
- Geometric Mean
The terms to measure the statistics dispersion are:
- Geometric variance and covariance
- Variance
- Mean absolute deviation around the mean
- Mean absolute difference
Beta-binomial distribution
It is the simplest Bayesian model that is widely used in intelligence testing, epidemiology, and marketing. A distribution is said to be beta-binomial if the probability of success is p, and the shape of the beat binomial parameter is α > 0 and β > 0. The parametric shape can be defined as the success probability:
- A distribution can approach a binomial distribution for the larger value of α and β.
- The value of discrete uniform distribution equals the distribution from 0 to n, if the value of both α and β is equal to 1.
- For the value of n = 1, the beta-binomial distribution is the same value as that of Bernoulli distribution.
The major difference between a beta-distribution and binomial distribution is that p is always fixed for a set of trials in a binomial distribution, whereas the p for beta-binomial is not fixed, and it changes from trial to trial.
Log-normal distribution
If the log to the power is normally distributed, then the variable is taken as lognormally distributed. Or we can say that ln(x) is normally distributed and that the variable x is assumed to have a log-normal distribution.
Properties of the log-normal distribution
- The expected value or the mean of distribution offers useful data about what an average would expect from a repeated trial number.
- The median of a log-normal distribution is another consideration of central tendency, and it is useful for outliers that help the means to lead.
- The distribution’s mode is a value with the highest probability of occurring.
- How to spread out the information can be measured by the variance. The square root of the variance and the standard deviation are useful as these have the same unit of the data.
Conclusion
This post as detailed different types of distribution in statistics with examples and their properties. Besides, this can help the students to understand the complicated terms of statistics. Therefore, you need to read this post carefully so that you can understand each term easily. The distribution in statistics is also necessary to write an assignment during their academic studies.
Recommended for you:
Tutorial

MOST COMMENTED
Tutorial
Important Methods in Matplotlib
Machine Learning
Bias and Variance Tradeoff Machine Learning
Tutorial
Multiclass and Multilabel Classification
Machine Learning
Reinforcement Learning in Machine Learning
Deep Learning
Alexnet Architecture Code
Machine Learning
Machine Learning Models Explained